Panels—and the data they generate—have been the research industry’s gold standard for nearly a century now, and they remain the most accurate tool to measure media audiences.
자세히 알아보세요: 패널 데이터란 무엇이며, 왜 중요한지, 그리고 앞으로의 방향에 대해 알아보세요.
패널 데이터란 정확히 무엇인가요?
미디어 조사에서 패널은 개인 정보를 공유하고 정기적인 연구 또는 일정 기간 동안 미디어 사용량에 대한 지속적인 측정에 참여하는 데 동의한 가구 또는 개인 그룹을 의미합니다.
하지만 모든 패널이 동일한 것은 아닙니다. 크게 두 가지 유형이 있습니다:
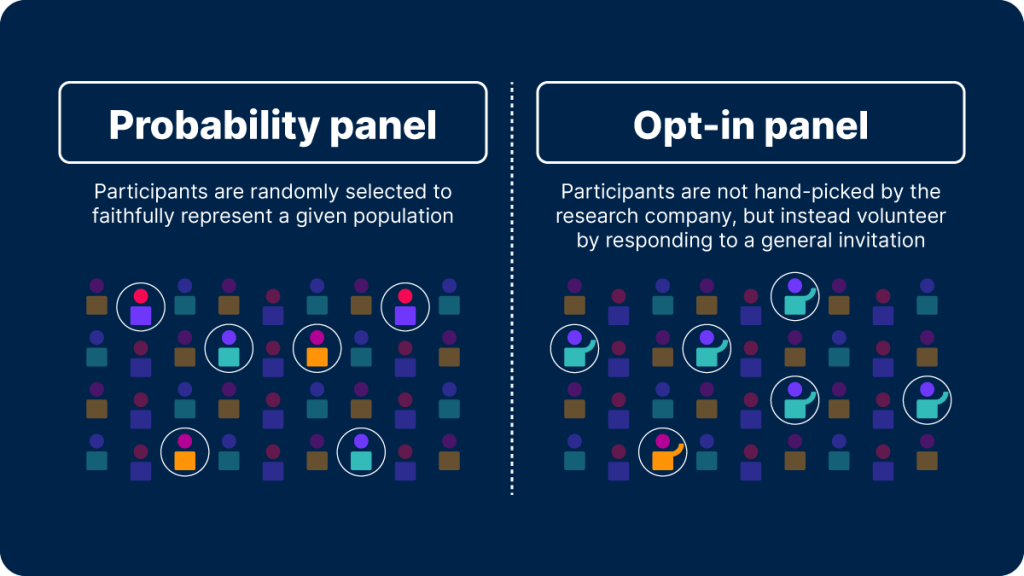
확률 패널
확률 패널의 참가자는 전국 TV 시청자 또는 지역 라디오 시장과 같이 주어진 모집단을 충실히 대표하도록 선정됩니다. 리서치 회사는 모집 프로세스를 관리하고 시간이 지나도 패널의 통계적 무결성을 유지하기 위해 세심한 주의를 기울입니다. 즉, 패널을 모집하고, 새 기기를 지체 없이 등록하고, 가구 규모와 구성의 변화를 고려하고, 사람들이 무엇을 하고 있는지 데이터가 정확하게 반영하는지 확인합니다. 닐슨의 TV 및 오디오 패널은 확률 패널입니다.
옵트인(편의성) 패널
Participants in opt-in panels volunteer by responding to a general invitation from a research company. Since only certain types of people might respond to that invitation, opt-in panels aren’t representative of any given population. However, they are extremely useful in audience measurement. They’re helpful in understanding biases in identity, used as calibration inputs to fine-tune models, and can validate and correct third-party information from big data partners. At Nielsen, opt-in panelists aren’t always actively metered, but we do use our large opt-in panel to validate third-party records from big data partners.
Probability panel data, combined with census data that speaks to the income, age and makeup of a household, gives you a statistically accurate look at who is consuming media.
확률 및 옵트인 패널을 함께 사용하면 미디어 소비에 대한 직접적인 인사이트를 제공하고, 인구조사 수준의 데이터에서 편향을 보정 및 제거하며, 여러 디바이스에서 잠재고객 참여를 가장 정확하게 파악할 수 있습니다.
패널리스트는 무엇을 위해 가입하나요?
일부 패널은 수동적인 참여가 아닌 적극적인 참여가 필요합니다. 패널은 정기적인 설문조사를 작성하거나, 버튼을 눌러 TV를 시청하고 있는지 확인하거나, 차 안에서 라디오를 듣거나 바에서 스포츠를 시청하는 등 집 밖에서의 활동을 포착하는 장치를 착용해야 할 수도 있습니다. 다른 패널은 리서치 회사에 하드웨어 또는 소프트웨어('미터'라고 함)를 설치하여 시청 중인 TV 프로그램이나 사용 중인 팟캐스트, 웹사이트 또는 앱 등 미디어 사용 내역을 기록하도록 승인하는 것 외에는 어떤 약속도 요구하지 않습니다.
가장 정확한 사람 수준의 데이터를 수집하고 그 가치를 극대화하기 위해서는 자동화된 측정이 아닌 적극적인 참여가 필요한 경우가 많습니다. 높은 데이터 품질을 유지하는 데 매우 중요한 협력 관계를 유지하기 위해 진지한 리서치 기업들은 모든 단계에서 마찰을 없애기 위해 패널 참여자 경험에 많은 투자를 합니다.
At Nielsen, we have four different kinds of panels:
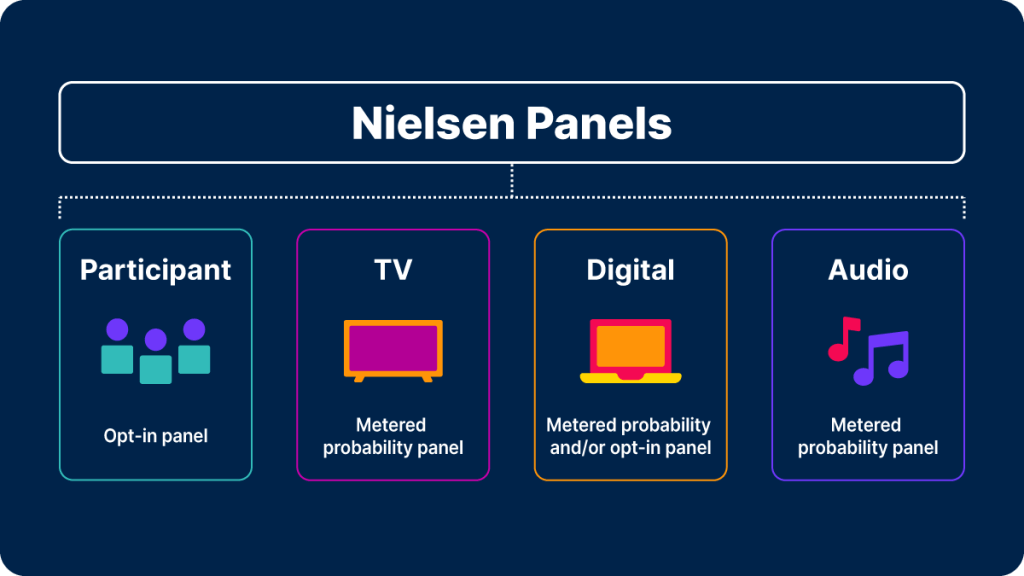
• TV — A probability panel that measures the who, what, how and where of TV and streaming audiences
• 오디오 — A probability panel that measures in-home and out-of-home audio consumption at the local and national level and consists of both metered and diary markets
• Digital — Depending on the market, a metered probability and/or opt-in panel that measures ad and content exposure for computers, mobile and across platforms
• 참가자 — An opt-in panel of registered, non-metered panelists to enhance our measured panel assets with features like big data calibration and identity validation
미디어 패널 데이터는 어떻게 사용되나요?
패널 데이터는 소비자 트렌드를 파악하려는 리서치 회사나 인구 소비 습관을 모니터링하려는 정부 기관에서 사용할 수 있지만, 미디어 패널 데이터는 콘텐츠 시청률과 광고 캠페인 도달 범위 및 빈도를 이해하려는 미디어 회사, 브랜드 및 광고주들이 가장 많이 사용합니다.
For networks, publishers and other media sellers, panel data helps them know their audience size, habits and trends, which is then used to inform programming, pricing and content distribution strategies.
For brands, advertisers and other media buyers, panel data is used to understand who’s actually seeing their ads, which platforms their target audiences prefer, and predict how these behaviors may change over time.
빅데이터 시대에 패널은 쓸모없나요?
You may be thinking: Do we even need panels now that we have big data from set-top boxes, smart TVs, streaming platforms, social media channels, retail media networks and everything in-between?
That’s a popular misconception.
First off, big data (like automatic content recognition {ACR} data from smart TVs) can tell us what’s playing on screen, but not who is watching, or how many friends and family might be sitting on the couch and watching too. In fact, it’s impossible to tell from big data alone whether a show or a movie is playing to an empty room. Nobody wants to pay for media without an audience.
What’s more, big data isn’t representative of the full media audience. The only way it could be is if everyone used the same technology and had access to the same content available to them. A cable company might have tens of millions of subscribers, but those viewers don’t all pay for the same channels or watch the same programs.
실제 오디언스를 식별하고 시청자의 인구통계학적 프로필을 정확히 파악하여 표현할 수 있는 능력이 없다면 빅데이터에만 의존하는 리서치 회사가 플랫폼, 기기, 서비스 전반에서 오디언스의 중복을 제거하고 전체 스토리를 통합하는 것은 불가능합니다.
두 가지 장점을 모두 누리려면 어떻게 해야 할까요?
분명히 말하지만, 표본 추출이나 무응답 문제로 인한 편향성은 대규모 데이터 세트만큼이나 확률 패널을 무력화시킬 수 있습니다. 그러나 적절한 규모, 세부 사항에 대한 적절한 주의, 통계에 대한 예리한 이해만 있다면 잘 운영되는 패널은 여전히 일반 인구를 대표하고 오늘날의 엄청나게 다양한 미디어 생태계에서 오디언스 구성에 대한 신뢰할 수 있는 추정치를 제공하는 가장 좋은 방법입니다.
그렇다면 빅 데이터는 완전히 쓸모없는 것일까요? 물론 아닙니다! 빅데이터의 규모 덕분에 미디어 사용량을 훨씬 더 세밀하게 분석할 수 있으며, 적절한 보정과 사람 기반 모델링을 적용하면 롱테일 프로그램과 도달하기 어려운 오디언스에게 귀중한 인사이트를 제공할 수 있습니다.
A number of organizations, including the World Federation of Advertisers, now believe that the combination of panels and big data is the true future of audience measurement, and many research companies are hard at work developing these capabilities.
Nielsen’s Need to Know reviews the fundamentals of audience measurement and demystifies the media industry’s hottest topics. Read every article here.
Note
1. Two notable early examples were the National Consumer Panel, launched by Samuel Barton in 1942 under Roosevelt’s Office of Price Administration initiative to measure household consumption of rationed goods during WWII; and the panel behind the Nielsen Radio Index, launched that same year by Arthur C. Nielsen to capture radio on/off and channel tuning activity using an ingenious mechanical device first developed at MIT: the Audimeter.