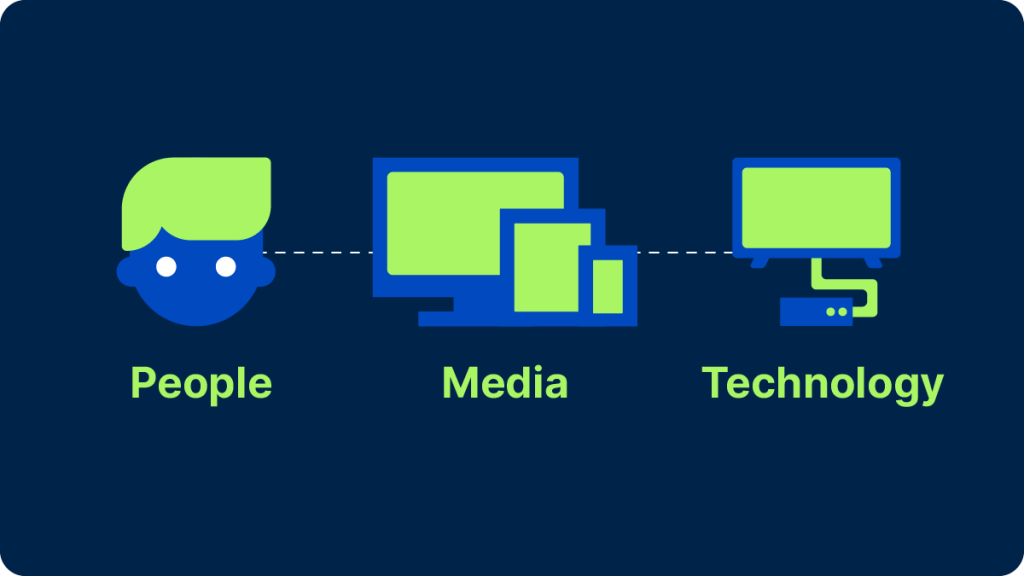
To measure TV audiences, you need three key ingredients: a data source (a combination of パネル そして big data capable of properly representing viewing audiences); technology (to capture and correctly identify viewing data); and metrics (to make sense of that viewing data for all stakeholders).
この記事では、最後の2つの要素に焦点を当てる:視聴データを取得するために業界は具体的にどのようなテクノロジーを使っているのか、そしてメディア企業や広告主はどのような指標を使ってビジネスを行っているのか。
しかしその前に、テレビ測定の重要な原則をいくつかおさらいしておこう。
現代テレビ測定の原則
個人レベルの測定:
Detecting what people are watching and who is watching are two separate things. Brands want to reach individual consumers, not households, and media companies want to personalize their offerings to individuals, too. While big data1 collection is deeply automated, it has drawbacks, including failing to register who’s in front of the screen. That’s one of the main reasons why combining big data with data from people-based panels has become such an industry priority.2
イベントベースのメディア:
純粋なリニアテレビの世界では、視聴者は決められたスケジュールに基づいて視聴していた。メディア企業は、その時間帯に現れると予想される視聴者のみに基づいて番組スケジュールを埋め、広告枠を販売していた。今日、視聴者は自分の好きな時間に視聴しており、オンデマンド・ストリーミングと、予定された無料広告付きストリーミング(FAST)チャンネルの両方が台頭しているため、スケジュールベースの視聴という概念は進化している。
目に見えない技術:
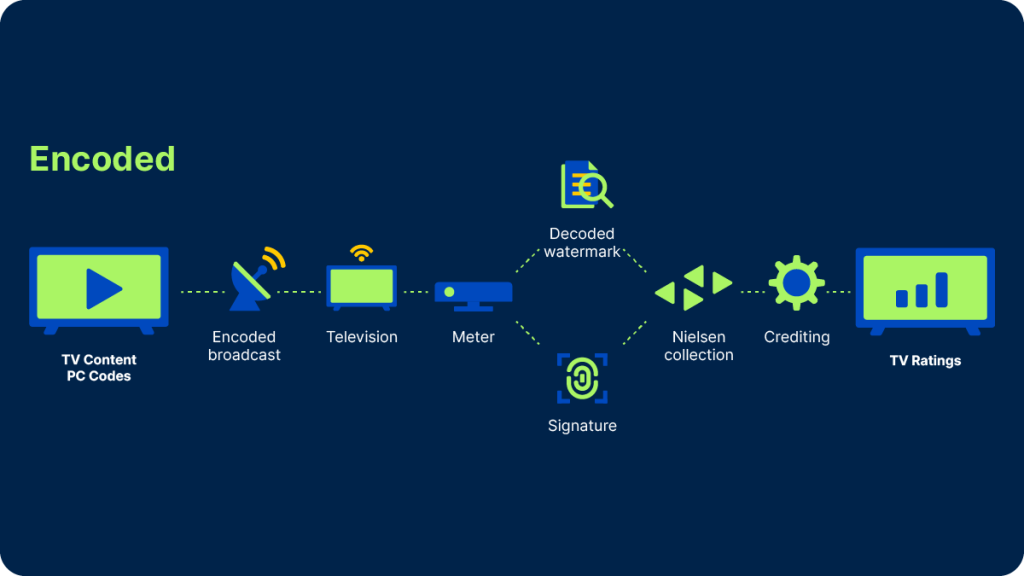
At Nielsen, we developed technology to encode inaudible watermarks3 into a TV broadcaster’s audio signal and decode them in our panel homes, whether live or time-shifted. And for cases where watermarks couldn’t be detected, we included software in our meters capable of composing audio ‘fingerprints’ on the fly for comparison against a reference library. We’ve enhanced those technologies over time but they still form the backbone of our metering infrastructure today. In fact, we’ve upgraded both watermarking and fingerprinting capabilities to increase ad detection frequency and start reporting on subminute events.
すべての視聴者を数える
To assign viewing to the right person, we currently use within our panel what we call a ‘people meter,’ which can take the form of a set-top device with a remote control or a wearable device, like a clip, pendant or wristband. Our first people meter dates back to 1987, and the technology is crucial in an industry where the ultimate focus is on the individual, not the household.
The benefit of having high-quality individual viewer data is two-fold: It provides demographic audience estimates4 and it allows us to estimate co-viewing in big datasets.
2つの異なるオーディエンスデータの使用法
Now that we’ve examined some of the key technologies used to capture the what そして who of TV viewing, what do we do with it?
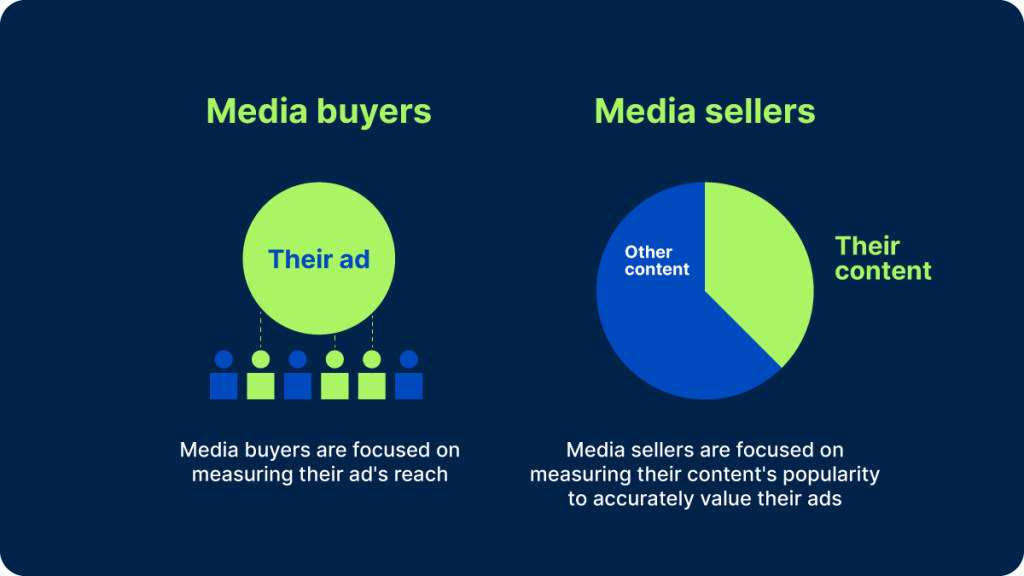
そのデータの主なユーザーは、メディアバイヤー(代理店や広告主など)とメディアセラー(パブリッシャーやプラットフォームなど)の2つで、それぞれの層はテレビ計測を少し違った角度から見ている。
For media companies, the most iconic measure of a TV show’s success — and how the inventory should be priced — has been the rating. It’s synonymous with our company name and a big part of its appeal comes from its simplicity: It’s just the percentage of the (TV-owning) population that watched a particular program or commercial. There are many variations: A rating may be based on live viewing only, live + same day playback, live + 3 days, live + 7 days, or even live + 35 days. And there are ratings for households as well as for specific demographic groups.
Many of these figures are published daily by the trade press, and we publish a few topline rankings ourselves every week. With more and more people watching TV content in streaming-first homes,5 we are starting to size up success in terms of impressions to account for all possible viewing platforms.6
ブランドとそのメディア・エージェンシーにとって、その目的は、自社の製品やサービスに対する興味を喚起するために、適切なクリエイティブと適切なフリークエンシーで、特定のデモグラフィック・プロフィールに属する一定数の視聴者にリーチすることである。特に複数のプラットフォームでキャンペーンを展開する場合、フリークエンシーをコントロールするのは必ずしも容易ではなく、テレビ広告主はしばしば、リーチとフリークエンシーが掛け合わされたグロス・レーティング・ポイント(GRP)を購入することになるが、フリークエンシーは個々の視聴者にはほとんどコントロールされないままである。しかし、最終的には、広告主は広告インプレッションに最も関心がある。番組、ネットワーク、プラットフォームは、できるだけ効率的にターゲット視聴者にリーチするための手段である。
メディア企業にはテレビ視聴者を広く定義するインセンティブがある一方、広告主には視聴者を狭く定義し、ターゲットにヒットしたインプレッションにのみ料金を支払うインセンティブがある。では、両者はどのように折り合いをつけるのだろうか?
現在および将来の測定状態
今日、メディアの買い手と売り手は、番組内で放映されるすべてのコマーシャルの平均視聴率を測定する平均CM分視聴率に頼って取引を行っている。これらの指標の中で最も広く使われているのは「C3」と呼ばれるもので、生放送+3日分の番組再生を考慮したもので、通常は成人18~49歳(主要な購買層として見られている)全員を対象とするが、他の主要な層を対象とすることもある。同様の指標(C7)は、7日分の再生が望ましいと判断される場合に使用できる。
2つの重要な進展が進行中である。ひとつはデータのソースに関するもので、もうひとつはメトリクスの計算方法に関するものだ。
新しいデータソース:
業界はパネル+ビッグデータ測定パラダイムへの移行過程にあり、最新のビッグデータセットの規模を活用して番組カバー率を高め、パネルデータはギャップを埋め、人口統計学的行動をモデル化するために使用される。2023年9月、ニールセンは売買のためのビッグデータを用いたC3とC7の視聴率を導入した。パネルのみの測定と並行して制作を続ける。
CMを測定する新しい方法:
ニールセンのメーターが更新され、分未満のレベルで透かしコードを検出できるようになりました。これは、たとえ15秒以下であっても、個々のCMに独自の視聴率をクレジットできるようになることを意味する。最終的に、これは業界がより柔軟できめ細かい取引をするのに役立つだろう。
これらの変更には、慎重なプランニング 、継続的なテストが必要だが、メディア企業は効果的な広告パッケージのポジションにプレミアムを置くことができ、広告主は個々のコマーシャルのパフォーマンスを測定することができ、最終的にはメディア支出をより適切に管理できるようになる。
Nielsen’s Need to Know reviews the fundamentals of audience measurement and demystifies the media industry’s hottest topics.
備考
1 I.e., Return path data (RPD) from set-top boxes and automatic content recognition (ACR) data from smart TVs. See Need to know – the pros and cons of big data in audience measurement for more details.
2 For more details on the promises of panel + big data measurement, read Need to know – what’s a panel, and why does it matter?
3 Watermarks are source codes that are embedded into content
4 TV News Check: Nielsen remains the currency of the TV realm (May 10, 2023)
5 ニールセン コネクティビティが、アメリカ人のテレビとの関わり方を変えている (2023)
6 Broadcasting & Cable: Impressions 2.0: the great equalizer (Feb 8, 2022)


