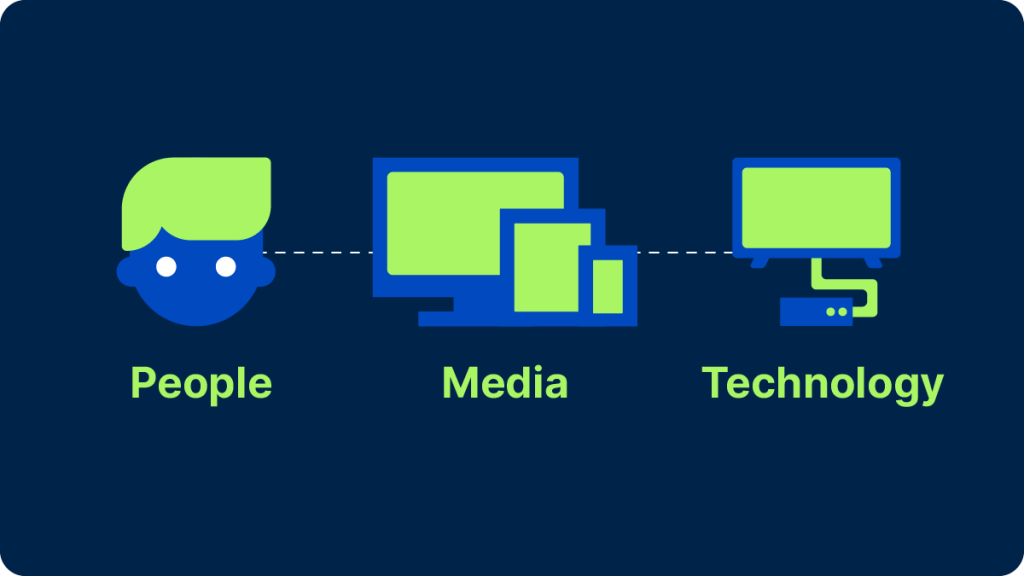
To measure TV audiences, you need three key ingredients: a data source (a combination of panel 和 big data capable of properly representing viewing audiences); technology (to capture and correctly identify viewing data); and metrics (to make sense of that viewing data for all stakeholders).
本文重点讨论后两个因素:该行业正在使用哪些具体技术来获取收视数据,媒体公司和广告商正在使用哪些指标来开展业务?
但首先,让我们回顾一下电视测量的几个关键原则。
现代电视测量的原则
个人层面的测量:
Detecting what people are watching and who is watching are two separate things. Brands want to reach individual consumers, not households, and media companies want to personalize their offerings to individuals, too. While big data1 collection is deeply automated, it has drawbacks, including failing to register who’s in front of the screen. That’s one of the main reasons why combining big data with data from people-based panels has become such an industry priority.2
基于事件的媒体:
在纯线性电视的世界里,观众习惯于根据既定的时间表收看节目。媒体公司完全根据预计在该时段出现的观众人数来编排节目和出售广告位。如今,观众根据自己的时间收看节目,随着点播流媒体和预定的免费广告支持流媒体(FAST)频道的兴起,基于节目表的收视观念也在不断演变。
隐形技术
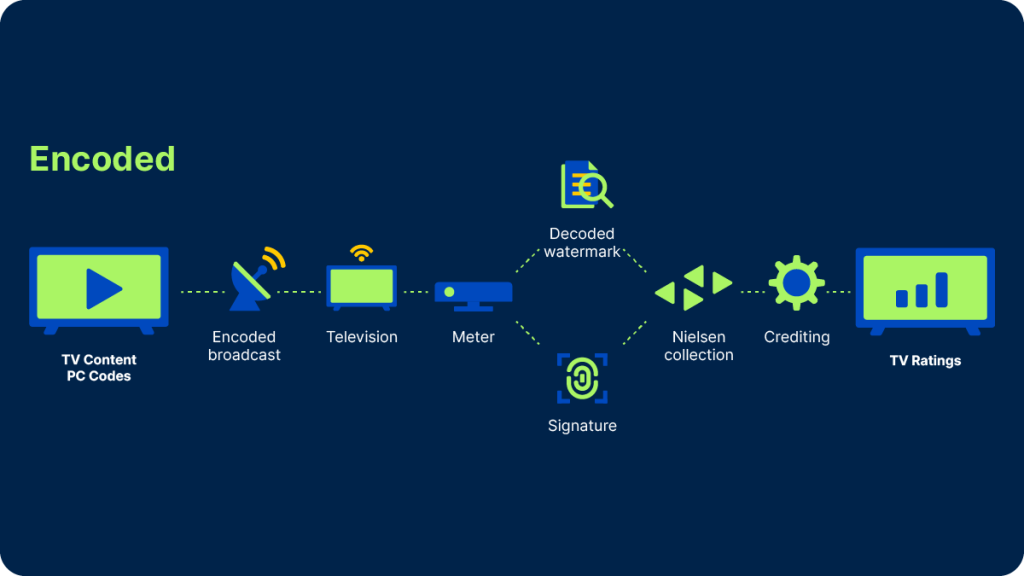
At Nielsen, we developed technology to encode inaudible watermarks3 into a TV broadcaster’s audio signal and decode them in our panel homes, whether live or time-shifted. And for cases where watermarks couldn’t be detected, we included software in our meters capable of composing audio ‘fingerprints’ on the fly for comparison against a reference library. We’ve enhanced those technologies over time but they still form the backbone of our metering infrastructure today. In fact, we’ve upgraded both watermarking and fingerprinting capabilities to increase ad detection frequency and start reporting on subminute events.
计算每一位观众
To assign viewing to the right person, we currently use within our panel what we call a ‘people meter,’ which can take the form of a set-top device with a remote control or a wearable device, like a clip, pendant or wristband. Our first people meter dates back to 1987, and the technology is crucial in an industry where the ultimate focus is on the individual, not the household.
The benefit of having high-quality individual viewer data is two-fold: It provides demographic audience estimates4 and it allows us to estimate co-viewing in big datasets.
两种不同的受众数据用途
Now that we’ve examined some of the key technologies used to capture the what 和 who of TV viewing, what do we do with it?
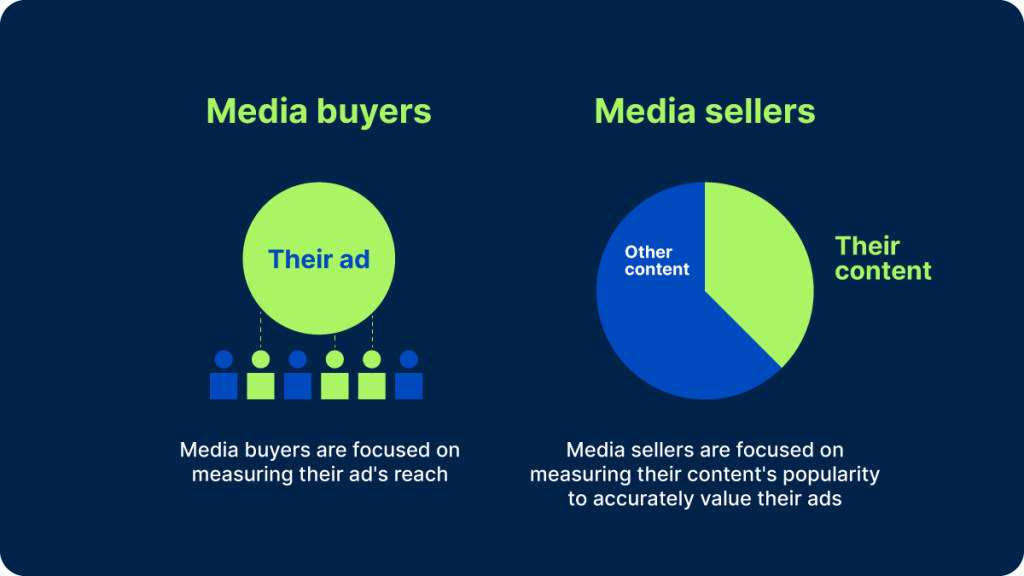
这些数据的主要用户有两个:媒体购买者(即代理商和广告商)和媒体销售者(即出版商和平台),每个群体看待电视测量的角度略有不同。
For media companies, the most iconic measure of a TV show’s success — and how the inventory should be priced — has been the rating. It’s synonymous with our company name and a big part of its appeal comes from its simplicity: It’s just the percentage of the (TV-owning) population that watched a particular program or commercial. There are many variations: A rating may be based on live viewing only, live + same day playback, live + 3 days, live + 7 days, or even live + 35 days. And there are ratings for households as well as for specific demographic groups.
Many of these figures are published daily by the trade press, and we publish a few topline rankings ourselves every week. With more and more people watching TV content in streaming-first homes,5 we are starting to size up success in terms of impressions to account for all possible viewing platforms.6
对于品牌及其媒体代理公司来说,目标是通过正确的创意和正确的频率,在特定的人口结构中接触到一定数量的观众,以激发他们对产品或服务的兴趣。频率控制并不总是那么容易实现,尤其是当广告活动在多个平台上进行时,电视广告商往往最终购买的是总收视点数(GRPs),在这种情况下,到达率和频率会成倍增加,但对于单个观众来说,频率在很大程度上仍然无法控制。归根结底,广告商最关心的还是广告印象。节目、网络和平台都是尽可能有效地接触目标受众的工具。
媒体公司有动力从广义上定义电视收视率,而广告商则有动力从狭义上定义电视收视率,并只为达到目标的收视率付费。那么,他们如何在中间找到平衡点呢?
当前和未来的测量状态
如今,媒体买家和卖家都依赖于平均广告分钟收视率来进行交易,这种收视率衡量的是一个节目中播出的所有广告的平均收视率。这些指标中使用最广泛的被称为 "C3",它考虑了一个节目的所有直播+3 天的回放,通常针对所有 18-49 岁的成人(被视为主要购买群体),但有时也针对其他主要人群。当认为 7 天的播放量更可取时,可以使用类似的指标(C7)。
目前有两项重要进展。一个与数据来源有关,另一个与这些指标本身的计算方式有关。
一个新的数据源:
该行业正在向 "面板+大数据 "测量模式过渡,即利用现代大数据集的规模来扩大节目覆盖面,并利用面板数据来填补空白和建立人口行为模型。2023 年 9 月,尼尔森推出了使用大数据进行买卖的 C3 和 C7 收视率。我们将继续在只进行面板测量的同时制作此类数据。
衡量商业广告的新方法:
尼尔森测量仪已经更新,可以在亚分钟级别检测水印代码。这意味着我们可以开始为单个广告设定自己的收视率,即使这些广告只持续 15 秒或更短时间。最终,这将有助于业界以更灵活、更细化的方式进行交易。
这些变化需要精心策划和不断测试,但它们有望使电视衡量方式更接近于当今数字广告的衡量方式,媒体公司可以对有效的广告包位置进行溢价,广告商可以衡量单个商业广告的表现--最终更好地管理他们的媒体支出。
Nielsen’s Need to Know reviews the fundamentals of audience measurement and demystifies the media industry’s hottest topics.
说明
1 I.e., Return path data (RPD) from set-top boxes and automatic content recognition (ACR) data from smart TVs. See Need to know – the pros and cons of big data in audience measurement for more details.
2 For more details on the promises of panel + big data measurement, read Need to know – what’s a panel, and why does it matter?
3 Watermarks are source codes that are embedded into content
4 TV News Check: Nielsen remains the currency of the TV realm (May 10, 2023)
5 Nielsen: 互联互通推动美国人如何接触电视 (2023)
6 Broadcasting & Cable: Impressions 2.0: the great equalizer (Feb 8, 2022)


