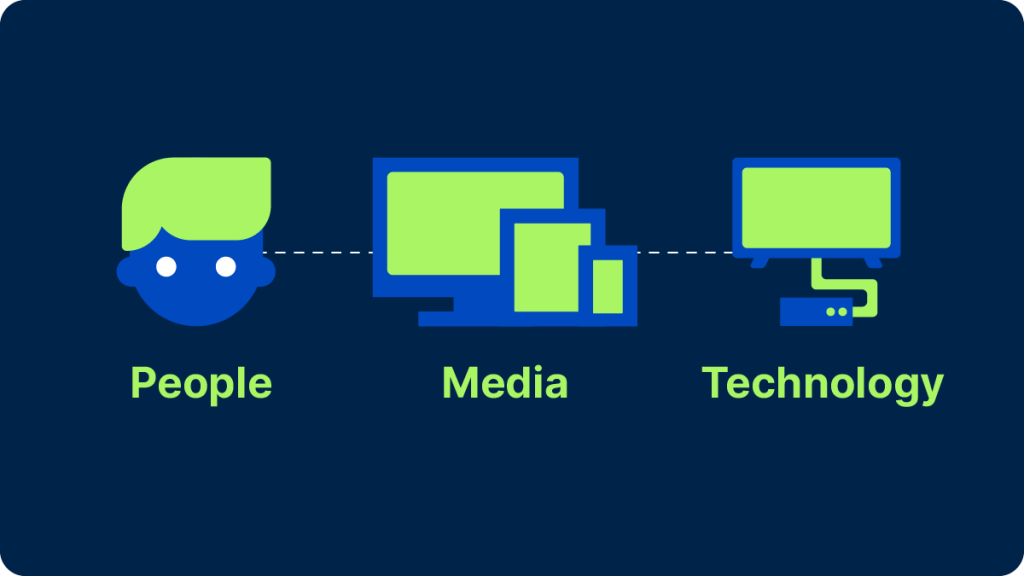
To measure TV audiences, you need three key ingredients: a data source (a combination of panel และ big data capable of properly representing viewing audiences); technology (to capture and correctly identify viewing data); and metrics (to make sense of that viewing data for all stakeholders).
บทความนี้มุ่งเน้นไปที่ส่วนผสมสองอย่างสุดท้าย: อุตสาหกรรมใช้เทคโนโลยีเฉพาะใดในการรวบรวมข้อมูลการรับชม และบริษัทสื่อและผู้โฆษณาใช้มาตรวัดใดในการดำเนินธุรกิจ?
ก่อนอื่น เรามาดูหลักการสำคัญบางประการของการวัดทีวีกันก่อน
หลักการวัดผลโทรทัศน์สมัยใหม่
การวัดระดับบุคคล:
Detecting what people are watching and who is watching are two separate things. Brands want to reach individual consumers, not households, and media companies want to personalize their offerings to individuals, too. While big data1 collection is deeply automated, it has drawbacks, including failing to register who’s in front of the screen. That’s one of the main reasons why combining big data with data from people-based panels has become such an industry priority.2
สื่อตามเหตุการณ์:
ในโลกของทีวีเชิงเส้นล้วนๆ ผู้ชมมักจะรับชมตามตารางเวลาที่กำหนดไว้ บริษัทสื่อต่างๆ จะจัดตารางรายการและขายโฆษณาตามผู้ชมที่คาดว่าจะมาในช่วงเวลาดังกล่าวเท่านั้น ปัจจุบัน ผู้ชมรับชมตามเวลาของตนเอง และด้วยการเพิ่มขึ้นของทั้งช่องรายการแบบออนดีมานด์และช่องรายการแบบฟรีพร้อมโฆษณา (FAST) แนวคิดในการรับชมตามตารางเวลาจึงเริ่มมีการพัฒนา
เทคโนโลยีที่มองไม่เห็น:
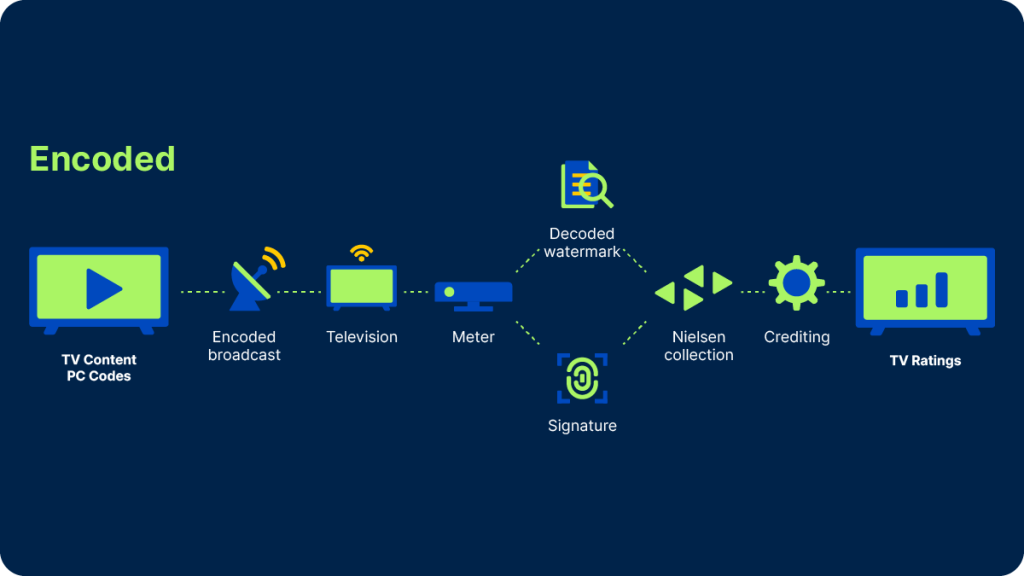
At Nielsen, we developed technology to encode inaudible watermarks3 into a TV broadcaster’s audio signal and decode them in our panel homes, whether live or time-shifted. And for cases where watermarks couldn’t be detected, we included software in our meters capable of composing audio ‘fingerprints’ on the fly for comparison against a reference library. We’ve enhanced those technologies over time but they still form the backbone of our metering infrastructure today. In fact, we’ve upgraded both watermarking and fingerprinting capabilities to increase ad detection frequency and start reporting on subminute events.
นับจำนวนผู้ชมทุกคน
To assign viewing to the right person, we currently use within our panel what we call a ‘people meter,’ which can take the form of a set-top device with a remote control or a wearable device, like a clip, pendant or wristband. Our first people meter dates back to 1987, and the technology is crucial in an industry where the ultimate focus is on the individual, not the household.
The benefit of having high-quality individual viewer data is two-fold: It provides demographic audience estimates4 and it allows us to estimate co-viewing in big datasets.
การใช้ข้อมูลผู้ชมสองแบบที่แตกต่างกัน
Now that we’ve examined some of the key technologies used to capture the what และ who of TV viewing, what do we do with it?
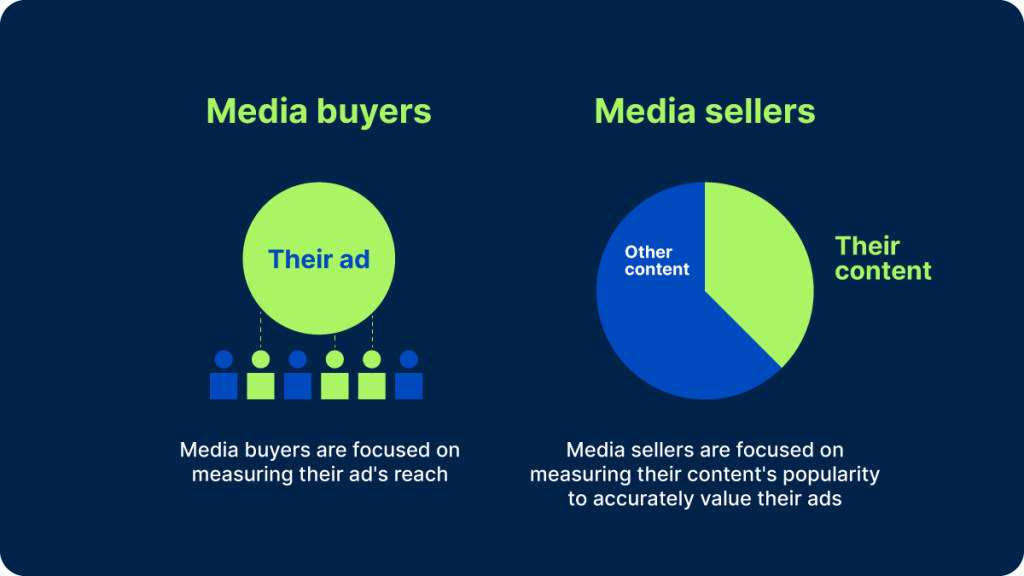
มีผู้ใช้หลักสองรายสำหรับข้อมูลดังกล่าว: ผู้ซื้อสื่อ (เช่น เอเจนซี่และผู้โฆษณา) และผู้ขายสื่อ (เช่น ผู้จัดพิมพ์และแพลตฟอร์ม) โดยกลุ่มผู้มีส่วนได้ส่วนเสียแต่ละกลุ่มจะดูการวัดผลทีวีจากมุมที่แตกต่างกันเล็กน้อย
For media companies, the most iconic measure of a TV show’s success — and how the inventory should be priced — has been the rating. It’s synonymous with our company name and a big part of its appeal comes from its simplicity: It’s just the percentage of the (TV-owning) population that watched a particular program or commercial. There are many variations: A rating may be based on live viewing only, live + same day playback, live + 3 days, live + 7 days, or even live + 35 days. And there are ratings for households as well as for specific demographic groups.
Many of these figures are published daily by the trade press, and we publish a few topline rankings ourselves every week. With more and more people watching TV content in streaming-first homes,5 we are starting to size up success in terms of impressions to account for all possible viewing platforms.6
สำหรับแบรนด์และเอเจนซี่สื่อ เป้าหมายคือการเข้าถึงผู้ชมจำนวนหนึ่งภายในกลุ่มประชากรเฉพาะ โดยใช้สื่อสร้างสรรค์ที่เหมาะสมและความถี่ที่เหมาะสมเพื่อกระตุ้นความสนใจในผลิตภัณฑ์หรือบริการของตน การควบคุมความถี่ไม่ใช่เรื่องง่ายเสมอไป โดยเฉพาะอย่างยิ่งเมื่อแคมเปญดำเนินไปบนแพลตฟอร์มต่างๆ และผู้โฆษณาทางทีวีมักจะซื้อคะแนนรวม (GRP) ซึ่งการเข้าถึงและความถี่จะคูณกัน แต่ความถี่ยังคงไม่สามารถควบคุมได้สำหรับผู้ชมแต่ละคน อย่างไรก็ตาม ในท้ายที่สุด ผู้โฆษณาจะกังวลมากที่สุดกับจำนวนการแสดงผลโฆษณา โปรแกรม เครือข่าย และแพลตฟอร์มเป็นเครื่องมือในการเข้าถึงกลุ่มเป้าหมายได้อย่างมีประสิทธิภาพที่สุด
ในขณะที่บริษัทสื่อมีแรงจูงใจในการกำหนดจำนวนผู้ชมทีวีอย่างกว้างๆ ผู้โฆษณามีแรงจูงใจในการกำหนดจำนวนผู้ชมอย่างแคบๆ และจ่ายเงินเฉพาะจำนวนการแสดงผลที่เข้าถึงกลุ่มเป้าหมายเท่านั้น แล้วพวกเขาจะพบกันตรงกลางได้อย่างไร
สถานะการวัดปัจจุบันและอนาคต
ในการทำธุรกรรมในปัจจุบัน ผู้ซื้อและผู้ขายสื่อจะต้องอาศัยเรตติ้งเฉลี่ยของโฆษณาแต่ละรายการ ซึ่งวัดจำนวนผู้ชมเฉลี่ยของโฆษณาทั้งหมดที่ออกอากาศในรายการ เมตริกที่ใช้กันอย่างแพร่หลายที่สุดคือ "C3" โดยจะคำนึงถึงการถ่ายทอดสดทั้งหมดและการเล่นซ้ำรายการเป็นเวลา 3 วัน โดยทั่วไปจะพิจารณาจากผู้ใหญ่ที่มีอายุระหว่าง 18 ถึง 49 ปี (ถือเป็นกลุ่มผู้ซื้อหลัก) แต่บางครั้งก็พิจารณาจากกลุ่มตัวอย่างหลักอื่นๆ ด้วย เมตริกที่คล้ายกัน (C7) สามารถใช้ได้เมื่อเห็นว่าการเล่นซ้ำ 7 วันเป็นเวลาที่เหมาะสมกว่า
มีการพัฒนาที่สำคัญสองประการที่กำลังดำเนินการอยู่ ประการหนึ่งเกี่ยวข้องกับแหล่งที่มาของข้อมูล และอีกประการหนึ่งเกี่ยวกับวิธีการคำนวณเมตริกเหล่านั้น
แหล่งข้อมูลใหม่:
อุตสาหกรรมกำลังอยู่ในระหว่างการเปลี่ยนผ่านไปสู่รูปแบบการวัดผลแบบแผงข้อมูล + ข้อมูลขนาดใหญ่ โดยที่ขนาดของชุดข้อมูลขนาดใหญ่สมัยใหม่ถูกนำมาใช้เพื่อเพิ่มการครอบคลุมของโปรแกรม และข้อมูลแผงข้อมูลจะถูกใช้เพื่อเติมช่องว่างและจำลองพฤติกรรมประชากรศาสตร์ ในเดือนกันยายน 2023 Nielsen ได้เปิดตัวการจัดอันดับ C3 และ C7 พร้อมข้อมูลขนาดใหญ่สำหรับการซื้อและการขาย เราจะยังคงผลิตสิ่งนี้ควบคู่ไปกับการวัดผลแบบแผงข้อมูลเท่านั้นของเรา
วิธีการใหม่ในการวัดผลโฆษณา:
เครื่องวัด Nielsen ได้รับการอัปเดตเพื่อตรวจจับรหัสลายน้ำในระดับนาทีต่อนาที ซึ่งหมายความว่าเราสามารถเริ่มให้เครดิตโฆษณาแต่ละรายการด้วยคะแนนของตัวเองแทนได้ แม้ว่าโฆษณาจะมีระยะเวลา 15 วินาทีหรือน้อยกว่าก็ตาม ในที่สุดแล้ว สิ่งนี้จะช่วยให้ภาคอุตสาหกรรมทำธุรกรรมได้อย่างยืดหยุ่นและมีรายละเอียดมากขึ้น
การเปลี่ยนแปลงเหล่านี้จะต้องมีการวางแผนอย่างรอบคอบและการทดสอบอย่างต่อเนื่อง แต่การเปลี่ยนแปลงเหล่านี้มีแนวโน้มที่จะทำให้การวัดผลทีวีใกล้เคียงกับการวัดผลโฆษณาดิจิทัลในปัจจุบันมากขึ้น โดยบริษัทสื่อสามารถให้ความสำคัญกับตำแหน่งแพ็คเกจโฆษณาที่มีประสิทธิผล และผู้โฆษณาสามารถวัดผลประสิทธิภาพของโฆษณาแต่ละรายการได้ และสุดท้ายก็สามารถจัดการค่าใช้จ่ายด้านสื่อได้ดีขึ้น
Nielsen’s Need to Know reviews the fundamentals of audience measurement and demystifies the media industry’s hottest topics.
Notes
1 I.e., Return path data (RPD) from set-top boxes and automatic content recognition (ACR) data from smart TVs. See Need to know – the pros and cons of big data in audience measurement for more details.
2 For more details on the promises of panel + big data measurement, read Need to know – what’s a panel, and why does it matter?
3 Watermarks are source codes that are embedded into content
4 TV News Check: Nielsen remains the currency of the TV realm (May 10, 2023)
5 นีลเส็น: การเชื่อมต่อเป็นแรงผลักดันให้ชาวอเมริกันมีส่วนร่วมกับทีวี (2023)
6 Broadcasting & Cable: Impressions 2.0: the great equalizer (Feb 8, 2022)


