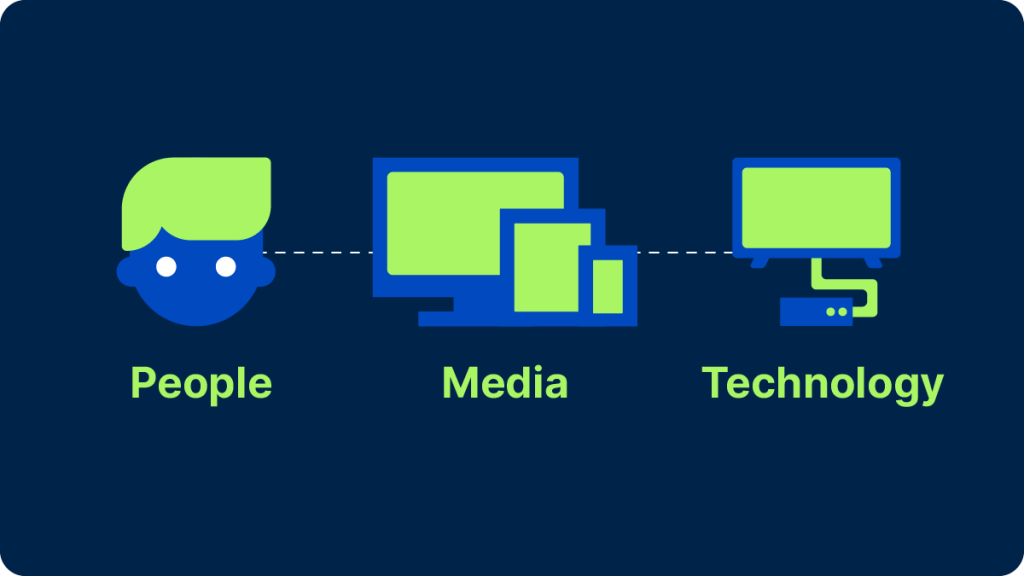
To measure TV audiences, you need three key ingredients: a data source (a combination of panel 그리고 big data capable of properly representing viewing audiences); technology (to capture and correctly identify viewing data); and metrics (to make sense of that viewing data for all stakeholders).
이 글에서는 마지막 두 가지 요소에 초점을 맞춥니다: 업계에서는 시청 데이터를 캡처하기 위해 어떤 특정 기술을 사용하고 있으며, 미디어 회사와 광고주는 비즈니스를 수행하기 위해 어떤 지표를 사용하고 있을까요?
하지만 먼저 TV 측정의 몇 가지 핵심 원칙을 살펴보겠습니다.
최신 TV 측정의 원칙
개인 수준 측정:
Detecting what people are watching and who is watching are two separate things. Brands want to reach individual consumers, not households, and media companies want to personalize their offerings to individuals, too. While big data1 collection is deeply automated, it has drawbacks, including failing to register who’s in front of the screen. That’s one of the main reasons why combining big data with data from people-based panels has become such an industry priority.2
이벤트 기반 미디어:
순수 선형 TV 세계에서는 시청자들이 정해진 스케줄에 따라 시청했습니다. 미디어 회사는 해당 시간대에 시청할 것으로 예상되는 시청자를 기준으로 프로그램 편성표를 작성하고 광고 지면을 판매했습니다. 오늘날 시청자들은 자신이 원하는 시간에 시청하고 있으며, 온디맨드 스트리밍과 광고 지원 무료 스트리밍(FAST) 채널의 등장으로 스케줄 기반 시청의 개념이 진화하고 있습니다.
보이지 않는 기술:
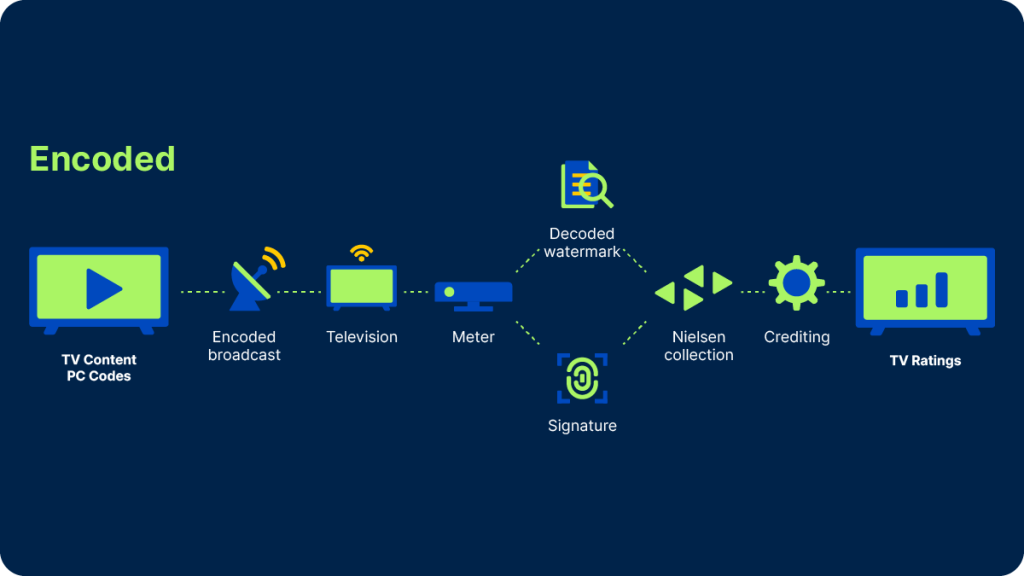
At Nielsen, we developed technology to encode inaudible watermarks3 into a TV broadcaster’s audio signal and decode them in our panel homes, whether live or time-shifted. And for cases where watermarks couldn’t be detected, we included software in our meters capable of composing audio ‘fingerprints’ on the fly for comparison against a reference library. We’ve enhanced those technologies over time but they still form the backbone of our metering infrastructure today. In fact, we’ve upgraded both watermarking and fingerprinting capabilities to increase ad detection frequency and start reporting on subminute events.
모든 시청자 수 계산
To assign viewing to the right person, we currently use within our panel what we call a ‘people meter,’ which can take the form of a set-top device with a remote control or a wearable device, like a clip, pendant or wristband. Our first people meter dates back to 1987, and the technology is crucial in an industry where the ultimate focus is on the individual, not the household.
The benefit of having high-quality individual viewer data is two-fold: It provides demographic audience estimates4 and it allows us to estimate co-viewing in big datasets.
두 가지 다른 오디언스 데이터 용도
Now that we’ve examined some of the key technologies used to capture the what 그리고 who of TV viewing, what do we do with it?
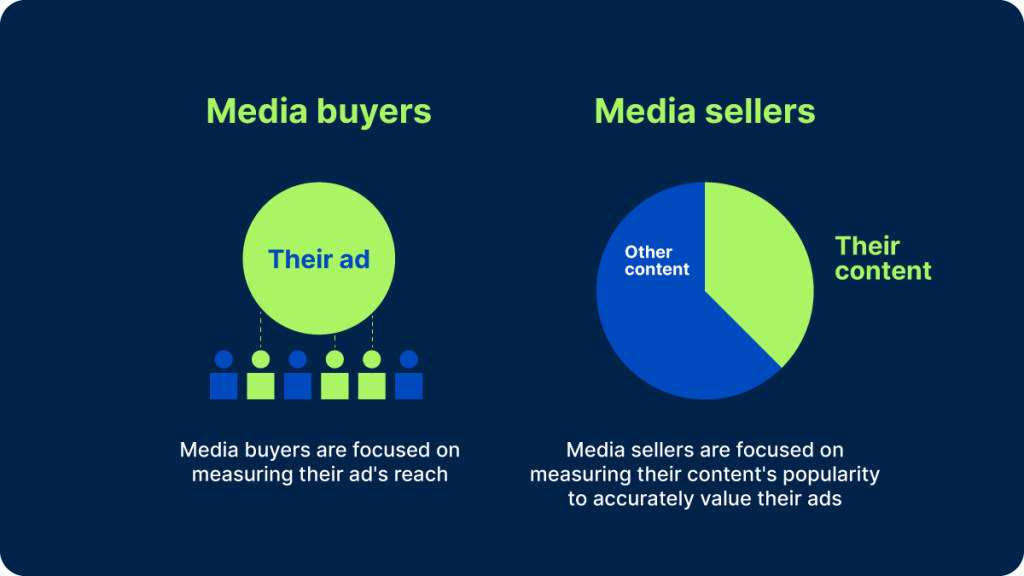
해당 데이터에는 미디어 구매자(대행사 및 광고주)와 미디어 판매자(퍼블리셔 및 플랫폼)라는 두 가지 주요 사용자가 있으며, 각 사용자 그룹은 조금씩 다른 각도에서 TV 측정을 바라봅니다.
For media companies, the most iconic measure of a TV show’s success — and how the inventory should be priced — has been the rating. It’s synonymous with our company name and a big part of its appeal comes from its simplicity: It’s just the percentage of the (TV-owning) population that watched a particular program or commercial. There are many variations: A rating may be based on live viewing only, live + same day playback, live + 3 days, live + 7 days, or even live + 35 days. And there are ratings for households as well as for specific demographic groups.
Many of these figures are published daily by the trade press, and we publish a few topline rankings ourselves every week. With more and more people watching TV content in streaming-first homes,5 we are starting to size up success in terms of impressions to account for all possible viewing platforms.6
브랜드와 미디어 대행사의 목표는 특정 인구통계학적 프로필 내에서 정해진 수의 시청자에게 적절한 크리에이티브와 적절한 빈도로 도달하여 제품이나 서비스에 대한 관심을 유도하는 것입니다. 특히 캠페인이 여러 플랫폼에서 실행되는 경우 빈도 제어가 항상 쉬운 것은 아니며, TV 광고주는 도달 범위와 빈도를 곱한 총 시청률 포인트(GRP)를 구매하지만 개별 시청자에 대한 빈도는 거의 제어되지 않는 경우가 많습니다. 하지만 궁극적으로 광고주는 광고 노출에 가장 큰 관심을 갖고 있습니다. 프로그램, 네트워크 및 플랫폼은 타겟 오디언스에게 최대한 효율적으로 도달할 수 있는 수단입니다.
미디어 기업은 TV 시청률을 넓게 정의하려는 인센티브가 있는 반면, 광고주는 이를 좁게 정의하고 목표에 도달한 노출 수에 대해서만 비용을 지불하려는 인센티브가 있습니다. 그렇다면 이 둘은 어떻게 중간에서 만날 수 있을까요?
현재 및 향후 측정 상태
오늘날 미디어 구매자와 판매자는 프로그램 내에서 방영되는 모든 광고의 평균 시청률을 측정하는 평균 광고 분 시청률에 의존하여 거래합니다. 이러한 지표 중 가장 널리 사용되는 것은 'C3'로, 일반적으로 주요 구매 그룹으로 간주되는 18-49세의 모든 성인을 대상으로 한 프로그램의 모든 실시간 + 3일 분량의 재생을 고려하지만, 때로는 다른 주요 데모도 고려하기도 합니다. 7일 분량의 재생이 더 바람직하다고 판단되는 경우 유사한 지표(C7)를 사용할 수 있습니다.
두 가지 중요한 개발이 진행 중입니다. 하나는 데이터의 출처와 관련된 것이고 다른 하나는 이러한 지표 자체의 계산 방식과 관련된 것입니다.
새로운 데이터 소스:
업계는 최신 빅데이터 세트의 규모를 활용하여 프로그램 커버리지를 늘리고, 패널 데이터를 사용하여 부족한 부분을 채우고 인구통계학적 행동을 모델링하는 패널+빅데이터 측정 패러다임으로 전환하는 과정에 있습니다. 2023년 9월, 닐슨은 구매 및 판매를 위한 빅데이터를 활용한 C3 및 C7 등급을 도입했습니다. 패널 전용 측정과 함께 이를 계속 생산할 예정입니다.
광고를 측정하는 새로운 방법:
닐슨 미터가 워터마크 코드를 1분 미만 수준에서 감지하도록 업데이트되었습니다. 즉, 15초 이하의 광고라도 개별 광고에 자체 등급을 부여할 수 있게 되었습니다. 궁극적으로 이는 업계가 보다 유연하고 세분화된 방식으로 거래하는 데 도움이 될 것입니다.
이러한 변화는 신중한 계획과 지속적인 테스트가 필요하지만, 미디어 기업은 효과적인 광고 패키지 위치에 프리미엄을 부여하고 광고주는 개별 광고의 성과를 측정하여 궁극적으로 미디어 지출을 더 잘 관리할 수 있게 됨으로써 TV 측정이 오늘날 디지털 광고의 측정 방식에 더 가까워질 수 있다는 가능성을 제시합니다.
Nielsen’s Need to Know reviews the fundamentals of audience measurement and demystifies the media industry’s hottest topics.
참고
1 I.e., Return path data (RPD) from set-top boxes and automatic content recognition (ACR) data from smart TVs. See Need to know – the pros and cons of big data in audience measurement for more details.
2 For more details on the promises of panel + big data measurement, read Need to know – what’s a panel, and why does it matter?
3 Watermarks are source codes that are embedded into content
4 TV News Check: Nielsen remains the currency of the TV realm (May 10, 2023)
5 Nielsen: 연결성이 미국인의 TV 시청 방식을 주도하고 있습니다. (2023)
6 Broadcasting & Cable: Impressions 2.0: the great equalizer (Feb 8, 2022)


