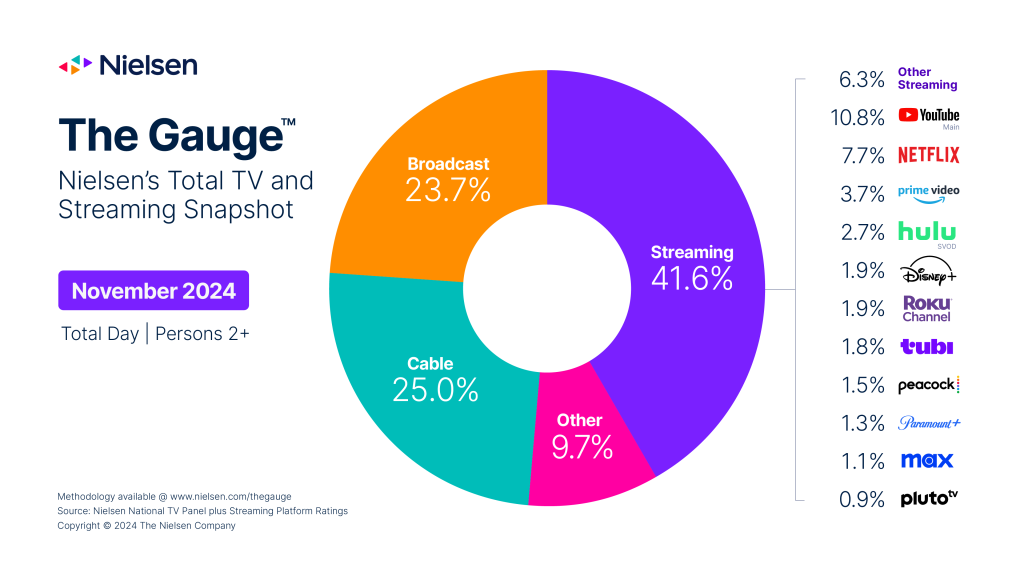
Streaming accounts for 41.6% of time spent watching TV in November, with The Roku Channel, Prime Video and YouTube each hitting platform-best shares
World Series on FOX and presidential election coverage drive viewing peaks on broadcast and cable

The November 2024 interval dates included 10/28/2024 through 11/24/2024. Nielsen reporting follows the broadcast calendar, and measurement weeks run Monday through Sunday.
NEW YORK – December 10, 2024 – Time spent watching TV in November reached a nine-month high, according to Nielsen’s latest report of The Gauge, as viewing levels increased 5% compared to October to record the largest monthly viewing total since February. TV viewership in the November interval was impacted primarily by sports, the presidential election and live streaming, all of which drove peak shares of TV for viewing categories each in separate weeks this month. Additionally, as this interval ended on November 24, the typical Thanksgiving holiday surge in TV viewing will be included in the December report of The Gauge.
Broadcast viewing in November was up 3% and accounted for 23.7% of time spent watching TV. The first week of the interval was the most dominant for the broadcast category as it featured Games 3, 4 and 5 of the MLB World Series on FOX, in addition to the usual slate of NFL and college football games. The final three World Series games totaled over 10 billion viewing minutes combined, and the Dodgers’ victory over the Yankees in the Game 5 conclusion drew 18.2 million viewers to make it the sixth most watched broadcast telecast this interval. This more concentrated week of broadcast sporting events lifted the category to a peak share of 24.9% of TV in the first week of the month, and helped increase broadcast sports viewing by 34% over October.
Coverage of the presidential election drove viewing increases in the second week of the month, most notably for cable. While cable ultimately finished with a 25.0% share of viewing in November, its share during the week of the election jumped to 26.5% of TV with much of the increase attributable to cable news. Interestingly, cable news viewing was up just 1% on a monthly basis, but climbed from 36 billion viewing minutes to 48 billion viewing minutes between weeks one and two (+32%) to give it the boost in share.
Streaming viewership increased 7.6% in the November interval and the category posted a record share of TV with 41.6% (+1.1 pt.). Some of this increase can be attributed to viewers seeking solace from the atypical, election-fueled news cycle covered by many traditional TV networks, and was also illustrated by the streaming category reaching 42.6% of TV viewing during the third week of the interval. Moreover, Netflix also exhibited peak viewership during week three when it hit 8.5% of TV (compared to its overall monthly share of 7.7%). This peak for Netflix coincides with the live-streamed Jake Paul vs. Mike Tyson boxing match, and was also fueled by viewing to its original series The Lincoln Lawyer, which was the most watched streaming program this interval with 3.9 billion viewing minutes.
There were also three streaming services that notched platform-best shares of TV in November, including The Roku Channel (up 12% to 1.9% of TV), Prime Video (up 10% to 3.7% of TV), and YouTube, which secured a new category record with 10.8% of TV. Peacock, while short of its Olympics-driven platform record, still drew the largest monthly increase among streamers for 1.5% of TV (+0.2 pt.). Peacock’s considerable increase was partially due to Despicable Me 4, which drove 1.5 billion viewing minutes and a 58% increase in kids viewing on the platform.
Note: October to November share changes for Hulu SVOD and Disney+ are not reflective of audience shifts, but are due to adjusting the portion of Hulu SVOD viewing that had been inadvertently attributed to Disney+ from August through October.
About The Gauge™
The Gauge™ is Nielsen’s monthly snapshot of total broadcast, cable and streaming consumption that occurs through a television screen, providing the industry with a holistic look at what audiences are watching. The Gauge was expanded in April 2024 to include The Media Distributor Gauge, which reflects total viewing by media distributor across these categories. Read more about The Gauge methodology and FAQs.
About Nielsen
Nielsen is a global leader in audience measurement, data and analytics. Through our understanding of people and their behaviors across all channels and platforms, we empower our clients with independent and actionable intelligence so they can connect and engage with their global audiences—now and into the future. Learn more at www.nielsen.com and connect with us on social media (X, LinkedIn, YouTube, Facebook and Instagram).
Press Contact
Lauren Pabst
