In a previous Need to Know article, we examined TV media buying and how it needs to evolve to meet the demands of today’s highly fragmented TV ecosystem. The playing field is changing rapidly, and buyers need new tools to understand and reach their target audiences.
업계의 최우선 과제는 빅데이터의 규모와 패널 기반 측정의 인구통계 및 통계적 정확성을 결합하여 더 나은 데이터 품질을 생성할 수 있는 새로운 측정 방법을 개발하는 것이었습니다.
Nielsen has spent years working out the best way to combine panels and big data, developing data partnerships with key players and thoroughly testing our new methodology in collaboration with industry stakeholders. Here are three findings that convinced us that the harmonious combination of big data and panel data was indeed the future of TV measurement.
닐슨의 골드 스탠다드 패널에 의해 보정된 빅 데이터로 ...
- 주요 데모(SCALE)에서 제로 등급이 감소합니다.
- 평균 상대 오류 감소(정확도)
- 표준 편차 감소(안정성)
빅 데이터의 의미와 패널이 빅 데이터와 어떤 관련이 있는지 살펴보겠습니다.
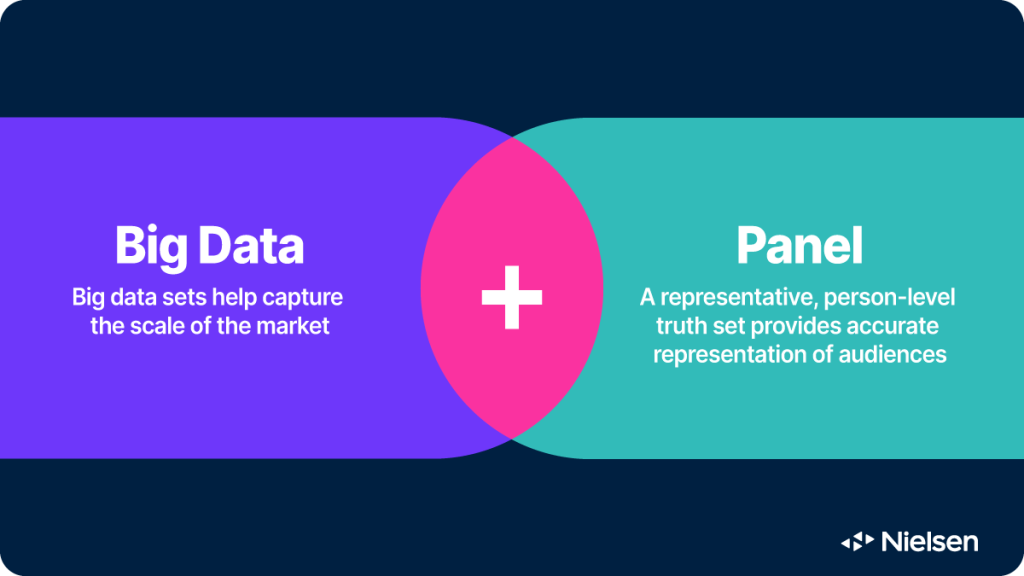
빅 데이터 및 패널: 함께하면 더 좋습니다
In the TV measurement space, big data refers to return-path data (RPD) from cable and satellite set-top boxes, as well as automatic content recognition (ACR) data from internet-connected smart TVs. How big is big data? Thanks to strategic data partnerships with companies like Comcast, DirecTV, Dish Network, Roku and Vizio, Nielsen currently has access to granular data from 75 million devices (and 45 million households) in the U.S. alone.

It’s a massive dataset, but it doesn’t capture TV viewing at the individual level—only at the device level. This makes it impossible to determine whether anyone is actually watching TV when the device is on or who the viewers and co-viewers might be at any point in time. To say nothing of the millions of households that don’t own any of those devices, only stream, watch TV over the air or have very different viewing habits than big data homes.
That’s where person-level panels come in. We’ve examined why panels still matter and how they should be used as a source of truth to overcome the limitations of big data. We followed those recommendations to develop the new National and Local TV currency for media buying and selling.
예를 들어, 현재 닐슨에서 RPD 또는 ACR 데이터를 분석할 때 패널에 어떤 디바이스가 포함되어 있는지 파악하고 해당 가정의 튜닝 데이터를 측정기에서 캡처한 개별 시청 행동과 비교할 수 있습니다. 패널을 신뢰할 수 있는 소스로 사용하여 빅데이터를 보정하고, 적합한 개인에게 시청을 할당하고, 빅데이터 데이터 세트의 시청자뿐만 아니라 전체 TV 인구에 대한 시청률 추정치를 예측할 수 있는 강력한 방법을 개발했습니다.
이 접근 방식에는 많은 이점이 있습니다. 지금까지의 분석에서 눈에 띄는 세 가지 이점은 다음과 같습니다.
규모: 주요 데모에서 제로 등급이 감소합니다.
When big data first emerged in the TV space, the immediate reaction from the industry was that it could help address one of its most vexing problems: zero-rated programs.
수천 개의 TV 프로그램에는 시청자 수가 너무 적어 패널 기반 측정으로 감지할 수 없는 시청자가 있으며, 심지어 10만 명 이상의 패널을 보유하고 있는 프로그램도 있습니다. 예를 들어, 2023년 1분기에 공중파, 케이블, 신디케이트 TV를 통틀어 362,168개의 방송이 있었는데, 이 중 13.9%는 전국 및 지역 TV 패널에서 35세에서 49세 사이의 시청자가 0명인 것으로 나타났습니다.
하지만 새로운 빅데이터 + 패널 방법론을 사용하여 동일한 방송을 조사한 결과, P35-49 시청자가 전혀 없는 방송은 458개에 불과했으며, 이는 해당 분기 전체 방송의 0.1%에 불과했습니다. 나머지는 시청자 구성이 독특하여 미디어 구매를 위한 완벽한 옵션이었을 가능성이 높습니다.
In other words, our enhanced measurement can eliminate virtually all cases of zero-rating for that age group, with similar results across all other traditional age targets: 99.1% for P35-49, 98.4% for P18-34, and 99.6% for P50-64.
이는 미디어 구매자와 판매자 모두에게 윈윈입니다: 판매자는 수익을 창출할 수 있는 더 많은 광고 인벤토리를 확보할 수 있고, 구매자는 틈새 오디언스에게 타겟을 도달할 수 있는 더 많은 옵션을 확보할 수 있습니다.
정확도: 평균 상대 오류 감소
빅데이터와 패널 데이터를 혼합하는 프로세스의 핵심은 모든 프로그램에 보정 계수를 적용하여 총 시청자 수를 방송국/요일/시간대/데모 수준에서 패널과 일치시키는 것입니다. 인구 통계와 시청자 모델링이 완료되면 빅데이터를 사용하여 자체적으로 측정하고, 그 결과를 패널 기반 통화의 결과와 비교하여 보정 인자를 알려줍니다.
이는 패널 전용 솔루션에 비해 분 단위의 오디언스 수준을 평준화하고 오디언스 추정치의 정확도를 향상시키는 효과가 있습니다.
We measured how this new Big Data + Panel calibration method performed against the existing panel-based currency in the New York designated market area (DMA) in May 2023 and found that the average relative error for audience estimates in that market decreased anywhere between 10% (for the early fringe daypart) and 25% (for primetime and late fringe).
정확도가 높아지면 미디어 구매자와 판매자가 더욱 안심하고 거래를 시작할 수 있습니다.
안정성: 표준 편차 감소
같은 시장, 같은 달인 2023년 5월에 닐슨은 새로운 화폐가 오전 6시 뉴스 프로그램의 시청률 안정성에 미치는 영향을 조사했습니다.
National broadcast and cable news programs tend to draw loyal followers day in and day out; the same is supposed to be true for local news shows, but it’s always been difficult to verify considering the size of some of our local TV panels. Local stations have struggled to understand whether day-to-day variations in audience size are the result of actual fluctuations or an artifact of panel-based measurement.
뉴욕 지역의 두 개의 개별 오전 6시 뉴스 프로그램을 자세히 살펴보면, 빅데이터가 단일 패널의 영향을 줄여 추정치에 안정성을 부여하기 때문에 한 달 동안 시청자 규모의 표준편차가 패널만 사용했을 때보다 새 통화를 사용할 때 36% 더 낮은 것으로 나타났습니다.
향상된 측정 기능이 비즈니스에 어떤 영향을 미칠까요?
No more zero-ratings, better accuracy and much improved stability. What’s not to like? We’ve been refining our new TV currency for years now, and now as the only accredited, Big Data + Panel solution with persons-level granularity, the media industry can trade on accurate, reliable measurement with confidence. We sincerely believe that it’s going to open a new chapter for TV 측정 and benefit all stakeholders.
To learn more about it and assess its impact on your business, please get in touch with our experts and discover the power of Big Data + Panel measurement.
Nielsen’s Need to Know reviews the fundamentals of audience measurement and demystifies the media industry’s hottest topics. Read every article here.


