There is no mistaking the impact of connectivity on how audiences are watching TV. In just the past five years, the number of households in the U.S. that get their TV content from an internet connection has increased by more than 210%1. The allure of an internet’s worth of content notwithstanding, a smaller, yet consistent, portion of TV homes continue to thrive on the over-the-air (OTA) broadcast programming they access for free using digital antennas—even when more than 70% of homes now have at least one smart TV2.
Nielsen’s 2024 Upfronts/NewFronts Guide revealed that, as of November 2023, more than 18% of U.S. TV households had at least one TV set enabled to receive free, broadcast programming. Given the many content options available to audiences, however, few homes rely solely on their digital antennas for TV content. Most complement their OTA access with content they can access from other sources. Sixty percent, for example, subscribe to a streaming video-on-demand service. The same is true of households that have cable or satellite services: In fact, nearly 4% have at least one OTA-enabled TV set.
While the way in which audiences access TV content continues to evolve, the concentration of OTA homes has remained consistent over the past five years. OTA homes represented 14.5% of U.S. TV households3 in third-quarter 2023.
ความสม่ำเสมอในการเข้าถึงโปรแกรม OTA รวมถึงการใช้งานของผู้จัดจำหน่ายโปรแกรมวิดีโอหลายช่องทางเสมือนจริง (vMVPD เช่น Hulu Live, YouTube TV, Sling TV) เน้นย้ำถึงการมีส่วนร่วมอย่างต่อเนื่องของผู้ชมทีวีกับโปรแกรมเชิงเส้นแบบดั้งเดิม ในความเป็นจริง ประมาณ 92% ของครัวเรือนที่รับชมทีวีไม่ว่าจะอยู่ในประเภทใด ได้รับชมโปรแกรมเชิงเส้นในรูปแบบใดรูปแบบหนึ่งระหว่างเดือนตุลาคม 2022 ถึงเดือนตุลาคม 2023
ประมาณ 92% ของบ้านที่รับชมรายการโทรทัศน์ประเภทเชิงเส้น
In addition to highlighting the consistent appeal of traditional broadcast programming, the steadfast portion of homes that access this content with digital antennas is a critical audience measurement consideration, especially as big data gains momentum as a measurement source amid rising connected TV (CTV)4 usage.
With CTV usage accounting for just over 32% of TV usage among adults 18 and older5, it makes sense that companies are looking to leverage the data from smart TVs and set-top-boxes from multichannel video programming distributors (MVPDs; e.g., DirecTV, Cox, Comcast Xfinity, DISH). We know that these data sources can advance the science of audience measurement, but they don’t capture OTA viewing.
ข้อมูลขนาดใหญ่สามารถส่งเสริมวิทยาศาสตร์ในการวัดผลผู้ชมได้ แต่ไม่สามารถจับภาพการรับชม OTA ได้
ตามการประมาณการของ Nielsen's TV Universe สำหรับปี 2023-24 สหรัฐอเมริกามีครัวเรือนที่รับชมทีวี 125 ล้านครัวเรือน ซึ่งเพิ่มขึ้น 1% จากปีก่อนหน้า นั่นหมายความว่าครัวเรือนในสหรัฐอเมริกาเกือบ 97% มีทีวีอย่างน้อยหนึ่งเครื่องที่ใช้ดูรายการต่างๆ ครัวเรือนเหล่านี้มีประชากรเกือบ 315.3 ล้านคน
บ้านเกือบ 23 ล้านหลังในสหรัฐฯ เข้าถึงรายการทีวีฟรีโดยใช้เสาอากาศดิจิทัล
ในกลุ่มครัวเรือนที่มีทีวี 18.125 ล้านครัวเรือนเป็นครัวเรือนที่ใช้บริการ OTA และอีก 4.625 ล้านครัวเรือนเป็นครัวเรือนที่มีทีวีเคเบิลและดาวเทียมซึ่งมีทีวีที่รองรับ OTA ด้วย โดยรวมแล้ว ครัวเรือน 22.750 ล้านครัวเรือนเข้าถึงเนื้อหาทีวีผ่านเสาอากาศ OTA ซึ่งเป็นอุปกรณ์ที่อยู่นอกเหนือขอบเขตของการรวบรวมข้อมูลขนาดใหญ่
การมีส่วนร่วมที่สอดคล้องและมีนัยสำคัญกับการเขียนโปรแกรมเชิงเส้นมีความโดดเด่นด้วยเหตุผลสองประการ:
- บ้านทีวีส่วนใหญ่ยังคงรับชมรายการทีวีแบบดั้งเดิมที่มีโฆษณาสนับสนุน
- แหล่งข้อมูลขนาดใหญ่เพียงอย่างเดียวไม่สามารถให้ข้อมูลเชิงลึกเกี่ยวกับพฤติกรรมการรับชมของผู้ชมหลายล้านคนที่ดูทีวีผ่านเสาอากาศดิจิทัลได้
นอกเหนือจากค่าเฉลี่ยระดับประเทศแล้ว การใช้งาน OTA ยังมีบทบาทมากขึ้นในเมืองที่เลือก เช่น ในเมืองฮูสตัน บ้านที่มีทีวีมากกว่า 27% มีทีวีอย่างน้อย 1 เครื่องที่เปิดใช้งานเพื่อรับรายการออกอากาศฟรี โดยเกือบ 24% ใช้เสาอากาศเป็นช่องทางหลักในการรับชมทีวี เปอร์เซ็นต์การใช้งาน OTA สูงเกิน 30% ในพื้นที่ตลาดที่กำหนด (DMA) ที่เลือกไว้ โดยโอคลาโฮมาซิตี้เป็นเมืองที่มีผู้ใช้ทีวีมากที่สุด โดย 37.3% ของบ้านที่มีทีวีในตลาดนี้มีทีวีที่เปิดใช้งาน OTA อย่างน้อย 1 เครื่อง
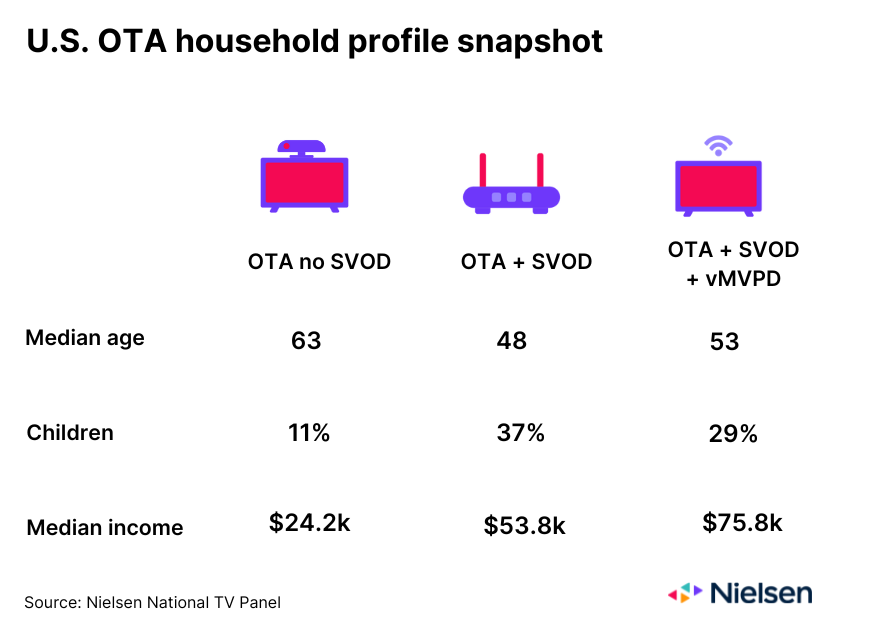
Combined with person-level demographic information from Nielsen’s National TV panel, OTA audience data provides advertisers and agencies with insight that’s out of reach of big data. Nearly 60% of OTA households that don’t subscribe to a subscription video on demand (SVOD) service, for example, are households of one person, while 45% of OTA households that subscribe to an SVOD service but don’t use a vMVPD are home to three or more people. From an income perspective, however, OTA households that subscribe to an SVOD service and use a vMVPD are the biggest earners.
การเชื่อมต่อที่เพิ่มขึ้นระหว่างผู้ชมยังคงมีบทบาทสำคัญในวิธีที่ผู้ชมเข้าถึงเนื้อหาทีวี แต่รายการออกอากาศ OTA ฟรียังคงเป็นสิ่งสำคัญสำหรับครัวเรือนทีวีในสหรัฐฯ เกือบ 20% จากมุมมองของมูลค่า ผู้โฆษณาและเอเจนซี่ต้องการข้อมูลเชิงลึกเกี่ยวกับผู้ชมเกือบ 23 ล้านคนที่รับชมรายการนี้ ซึ่งเป็นรายการที่อยู่นอกขอบเขตของข้อมูลขนาดใหญ่ เมื่อการวัดผลผู้ชมพัฒนาไปจนรวมถึงข้อมูลจากสมาร์ททีวีและกล่องเคเบิล จึงเป็นสิ่งสำคัญที่ผู้คนจะต้องเป็นศูนย์กลางของสมการ ไม่ใช่ข้อมูลขนาดใหญ่
Learn more about the power of big data and panel measurement here.
แหล่งที่มา
1Nielsen National TV Panel; September 2019 vs. September 2023. This percentage reflects the increase in homes that stream TV content from the internet and/or access TV content through a vMVPD.
2คณะกรรมการโทรทัศน์แห่งชาติ Nielsen ตุลาคม 2023
3This percentage includes homes that may have an vMVPD. Nielsen plans to reclassify homes with a vMVPD as Cable Plus homes in 2024.
4CTV refers to any television that accesses content from the internet. The most common use case is to stream video content.
5Nielsen National TV Panel; Q2 2023


