There is no mistaking the impact of connectivity on how audiences are watching TV. In just the past five years, the number of households in the U.S. that get their TV content from an internet connection has increased by more than 210%1. The allure of an internet’s worth of content notwithstanding, a smaller, yet consistent, portion of TV homes continue to thrive on the over-the-air (OTA) broadcast programming they access for free using digital antennas—even when more than 70% of homes now have at least one smart TV2.
Nielsen’s 2024 Upfronts/NewFronts Guide revealed that, as of November 2023, more than 18% of U.S. TV households had at least one TV set enabled to receive free, broadcast programming. Given the many content options available to audiences, however, few homes rely solely on their digital antennas for TV content. Most complement their OTA access with content they can access from other sources. Sixty percent, for example, subscribe to a streaming video-on-demand service. The same is true of households that have cable or satellite services: In fact, nearly 4% have at least one OTA-enabled TV set.
While the way in which audiences access TV content continues to evolve, the concentration of OTA homes has remained consistent over the past five years. OTA homes represented 14.5% of U.S. TV households3 in third-quarter 2023.
La costanza dell'accesso alla programmazione OTA, compreso l'utilizzo dei distributori virtuali di programmi video multicanale (vMVPD; ad esempio, Hulu Live, YouTube TV, Sling TV), evidenzia il continuo impegno del pubblico televisivo nei confronti della programmazione lineare tradizionale. Infatti, circa il 92% delle famiglie televisive, indipendentemente dalla classificazione, ha guardato una qualche forma di programmazione lineare tra ottobre 2022 e ottobre 2023.
Circa il 92% delle case con televisione guarda una qualche forma di programmazione lineare.
In addition to highlighting the consistent appeal of traditional broadcast programming, the steadfast portion of homes that access this content with digital antennas is a critical audience measurement consideration, especially as big data gains momentum as a measurement source amid rising connected TV (CTV)4 usage.
With CTV usage accounting for just over 32% of TV usage among adults 18 and older5, it makes sense that companies are looking to leverage the data from smart TVs and set-top-boxes from multichannel video programming distributors (MVPDs; e.g., DirecTV, Cox, Comcast Xfinity, DISH). We know that these data sources can advance the science of audience measurement, but they don’t capture OTA viewing.
I big data possono far progredire la scienza della misurazione dell'audience, ma non catturano la visione OTA
Secondo le stime dell'universo televisivo di Nielsen per il 2023-24, gli Stati Uniti contano 125 milioni di famiglie televisive, con un aumento dell'1% rispetto all'anno precedente. Ciò significa che poco meno del 97% delle famiglie statunitensi possiede almeno un televisore utilizzato per guardare i programmi. In queste famiglie vivono quasi 315,3 milioni di persone.
Quasi 23 milioni di case statunitensi accedono alla programmazione televisiva gratuita tramite antenne digitali
All'interno dell'universo delle famiglie televisive, 18,125 milioni sono famiglie OTA e altri 4,625 milioni sono case con TV via cavo e satellitare che dispongono anche di apparecchi televisivi con capacità OTA. In totale, 22,750 milioni di famiglie accedono ai contenuti televisivi attraverso un'antenna OTA, un dispositivo che non rientra nell'ambito della raccolta dei big data.
L'impegno costante e significativo con la programmazione lineare è notevole per due motivi:
- La stragrande maggioranza delle case televisive continua a guardare la programmazione tradizionale, supportata dalla pubblicità.
- Le fonti di big data da sole non sono in grado di fornire informazioni sui comportamenti di visione dei milioni di spettatori che guardano la TV utilizzando un'antenna digitale.
Al di fuori della media nazionale, l'uso dell'OTA gioca un ruolo molto più importante in alcune città. A Houston, ad esempio, oltre il 27% delle case dispone di almeno un televisore abilitato alla ricezione di programmi broadcast gratuiti e quasi il 24% utilizza l'antenna come mezzo principale per guardare la TV. La percentuale di utilizzo dell'OTA supera addirittura il 30% in alcune aree di mercato designate (DMA), con Oklahoma City in cima alla lista: Il 37,3% delle case con TV in questo mercato ha almeno un televisore abilitato all'OTA.
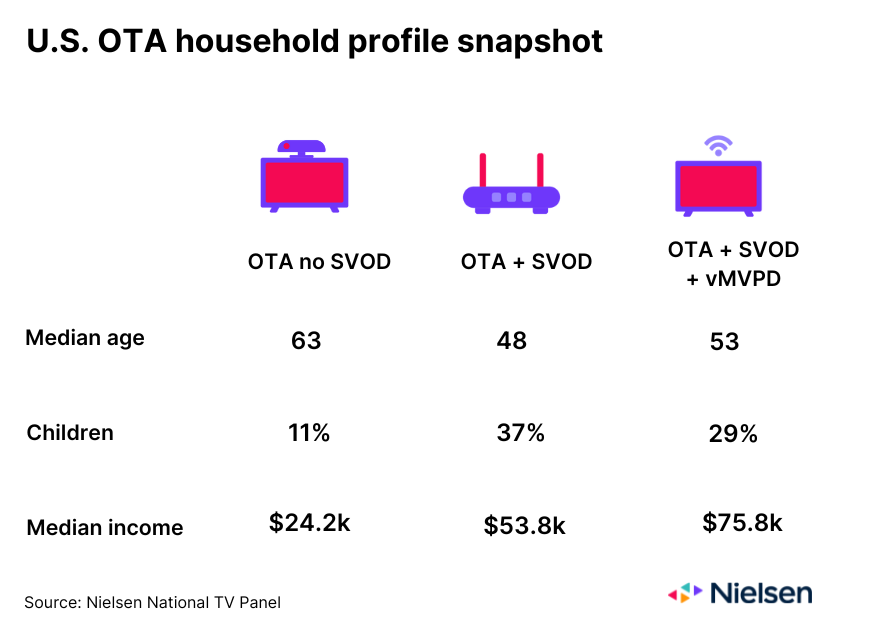
Combined with person-level demographic information from Nielsen’s National TV panel, OTA audience data provides advertisers and agencies with insight that’s out of reach of big data. Nearly 60% of OTA households that don’t subscribe to a subscription video on demand (SVOD) service, for example, are households of one person, while 45% of OTA households that subscribe to an SVOD service but don’t use a vMVPD are home to three or more people. From an income perspective, however, OTA households that subscribe to an SVOD service and use a vMVPD are the biggest earners.
La crescente connettività tra il pubblico continua a svolgere un ruolo significativo nel modo in cui gli spettatori accedono ai contenuti televisivi, ma la programmazione broadcast OTA gratuita rimane un punto fermo per quasi il 20% delle famiglie televisive statunitensi. Dal punto di vista del valore, gli inserzionisti e le agenzie hanno bisogno di conoscere i quasi 23 milioni di spettatori che si affidano a questa programmazione, una programmazione che non rientra nell'ambito della cattura dei big data. Man mano che la misurazione dell'audience si evolve per includere i dati provenienti dalle smart TV e dai decoder via cavo, sarà fondamentale che le persone, e non i big data, rimangano al centro dell'equazione.
Learn more about the power of big data and panel measurement here.
Fonti
1Nielsen National TV Panel; September 2019 vs. September 2023. This percentage reflects the increase in homes that stream TV content from the internet and/or access TV content through a vMVPD.
2Panel televisivo nazionale Nielsen; ottobre 2023
3This percentage includes homes that may have an vMVPD. Nielsen plans to reclassify homes with a vMVPD as Cable Plus homes in 2024.
4CTV refers to any television that accesses content from the internet. The most common use case is to stream video content.
5Nielsen National TV Panel; Q2 2023


