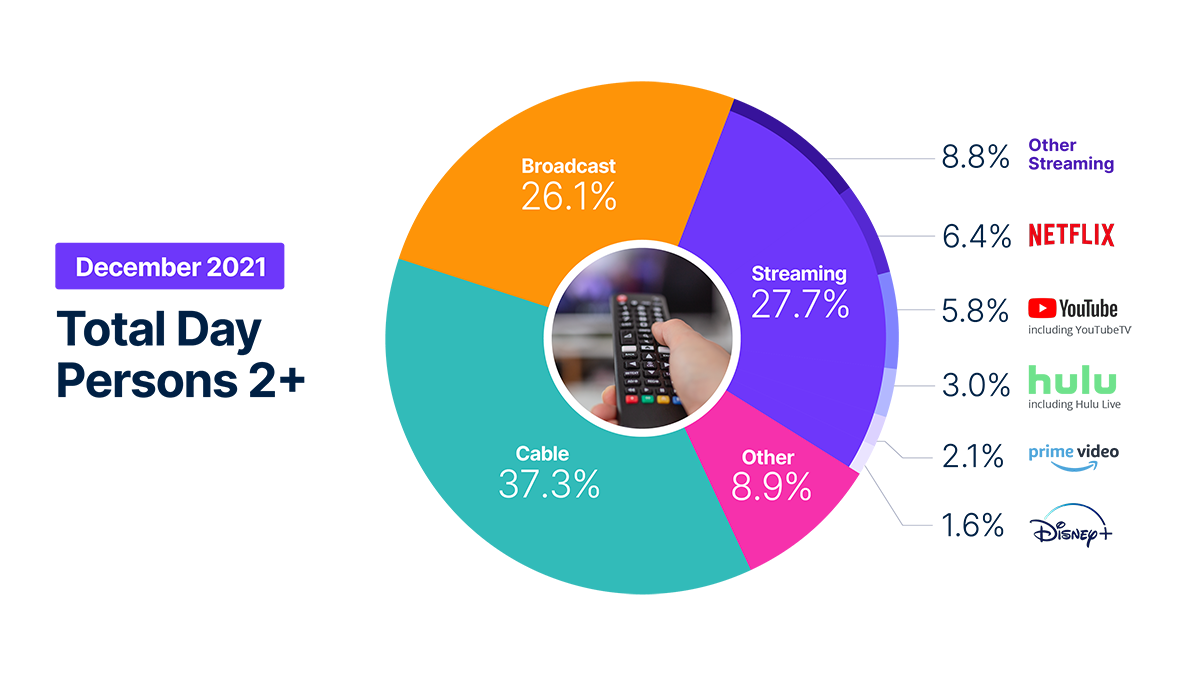
From a total viewing perspective, streaming was the clear outlier during the week of Christmas, as Americans watched a total of 183 billion minutes – an all-time high – across the growing range of over-the-top platforms. The aggregate viewing was enough to easily dethrone the 160 billion minutes watched during March 2020 (when stay-at-home restrictions began in the U.S.), as well as the 178 billion minutes watched during the week of Thanksgiving just a month earlier. The spike in streaming viewing also gave streamers 33% viewing share of total TV viewing during the week of Christmas, which was the most as measured by Nielsen.
From a reporting standpoint, this month’s edition of The Gauge expands the granularity of the data we provide. Instead of rounding, we have expanded viewing share calculations to display an additional decimal of data. This additional data will make it easier to see month-to-month changes in viewing share. In December, broadcast viewing dropped one share point and the “other” category, which includes video on-demand content, cable set top box streaming, gaming, and DVD usage, gained 1.6% share on the strength of video gaming, during what could be considered the “premiere season” in that category. Overall streaming was fairly flat for the month, remaining consistent with 28% share.


观看视频,聆听尼尔森产品战略高级副总裁 Brian Fuhrer 在幕后介绍支撑The Gauge 的一些收视变化。
METHODOLOGY AND FREQUENTLY ASKED QUESTIONS
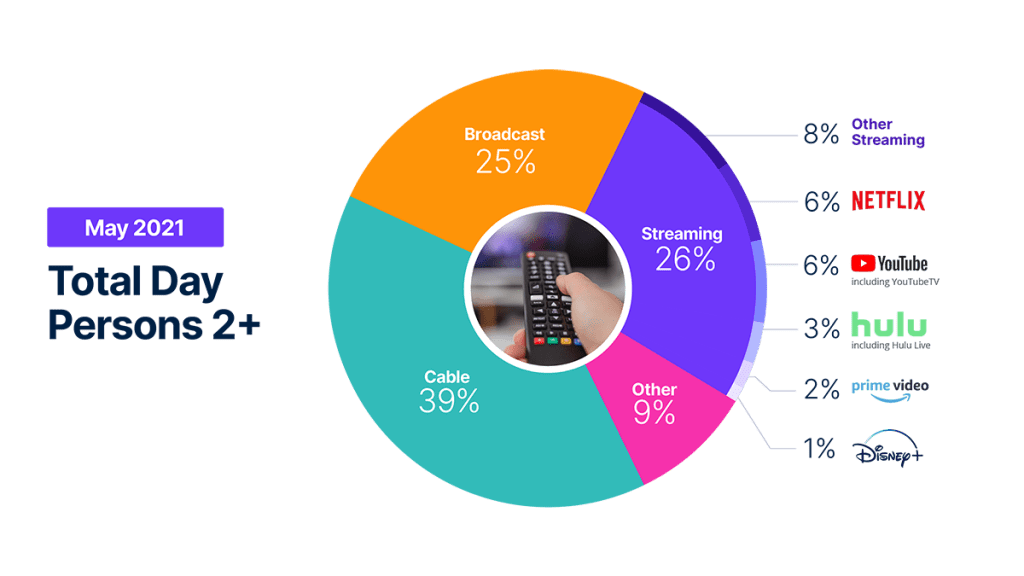
The Gauge 每月对消费者如何通过主要电视传输平台(包括广播、流媒体、有线电视和其他来源)获取内容进行宏观分析。它还包括主要流媒体发行商的细分。图表本身显示了各个流媒体分发商在各类电视和电视总使用量中所占的份额。
The Gauge 的数据来自两个单独加权的面板,然后合并成图表。尼尔森的流媒体数据来自全国电视面板中支持流媒体计费器的电视家庭子集。线性电视资源(广播和有线电视)以及总使用量基于尼尔森整体电视面板的收视情况。
All the data is based on a specific time period for each viewing source. The data, representing a 5 week month, includes a combination of Live+7 for weeks 1 – 4 in the data time period. (Note: Live+7 includes live television viewing plus viewing up to seven days later. Live +3 includes television viewing plus viewing up to three days later.)
在The Gauge中,"其他 "包括所有其他电视。这主要包括所有其他调谐(未测量来源)、未测量的视频点播(VOD)、通过有线电视机顶盒的流媒体、游戏和其他设备(DVD 播放)的使用。由于通过有线电视机顶盒进行的流媒体播放不计入各流媒体分发商,因此将其归入 "其他 "类别。通过有线电视机顶盒计入各个流媒体分发商是尼尔森在加强流媒体计量表技术的过程中不断追求的目标。
列为 "其他流媒体 "的流媒体平台包括未单独列出的任何高带宽电视视频流媒体。
Yes, Hulu includes viewing on Hulu Live and Youtube includes viewing on Youtube TV.
编码直播电视,又称编码线性流媒体,包括在广播和有线电视组(线性电视)以及流媒体和其他流媒体(如 Hulu Live、Youtube TV、其他流媒体 MVPD/vMVPD 应用程序)中。(vMVPD是将从主要节目网络获得授权的线性(电视)内容整合在一起,以独立订阅的形式打包,并可通过宽带连接的设备访问的分销商)。