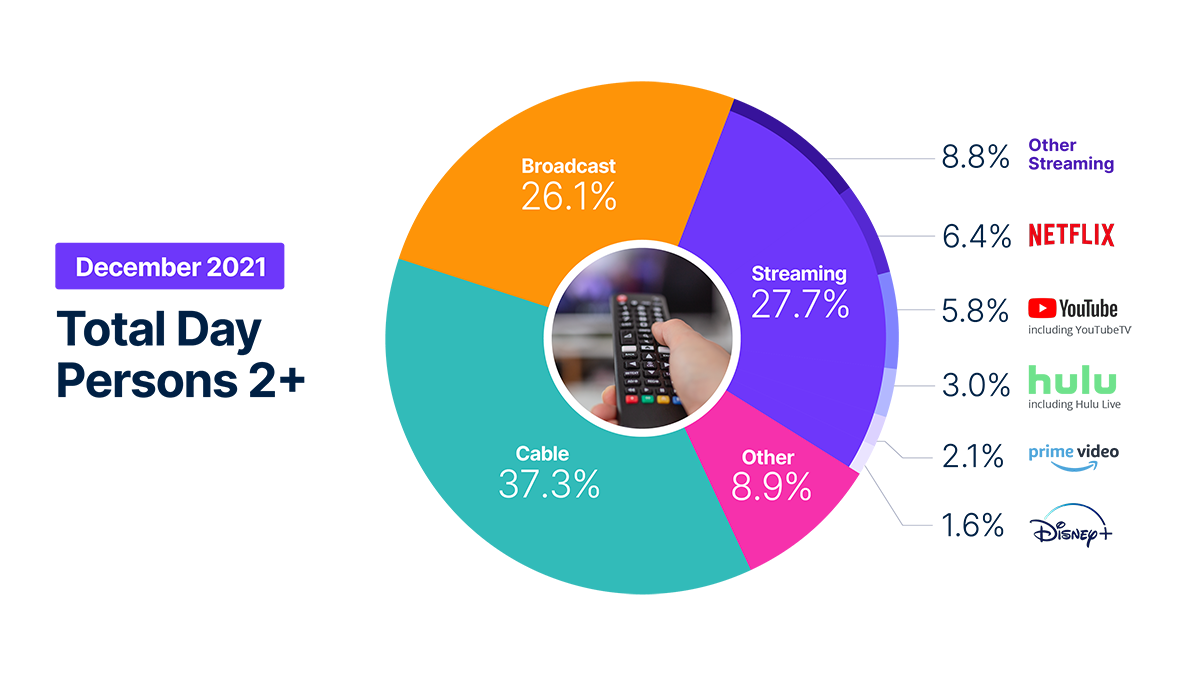
From a total viewing perspective, streaming was the clear outlier during the week of Christmas, as Americans watched a total of 183 billion minutes – an all-time high – across the growing range of over-the-top platforms. The aggregate viewing was enough to easily dethrone the 160 billion minutes watched during March 2020 (when stay-at-home restrictions began in the U.S.), as well as the 178 billion minutes watched during the week of Thanksgiving just a month earlier. The spike in streaming viewing also gave streamers 33% viewing share of total TV viewing during the week of Christmas, which was the most as measured by Nielsen.
From a reporting standpoint, this month’s edition of The Gauge expands the granularity of the data we provide. Instead of rounding, we have expanded viewing share calculations to display an additional decimal of data. This additional data will make it easier to see month-to-month changes in viewing share. In December, broadcast viewing dropped one share point and the “other” category, which includes video on-demand content, cable set top box streaming, gaming, and DVD usage, gained 1.6% share on the strength of video gaming, during what could be considered the “premiere season” in that category. Overall streaming was fairly flat for the month, remaining consistent with 28% share.


ニールセンの製品戦略担当SVPであるブライアン・フーラーが、The Gauge支える視聴の変化の舞台裏を紹介するビデオをご覧ください。
METHODOLOGY AND FREQUENTLY ASKED QUESTIONS
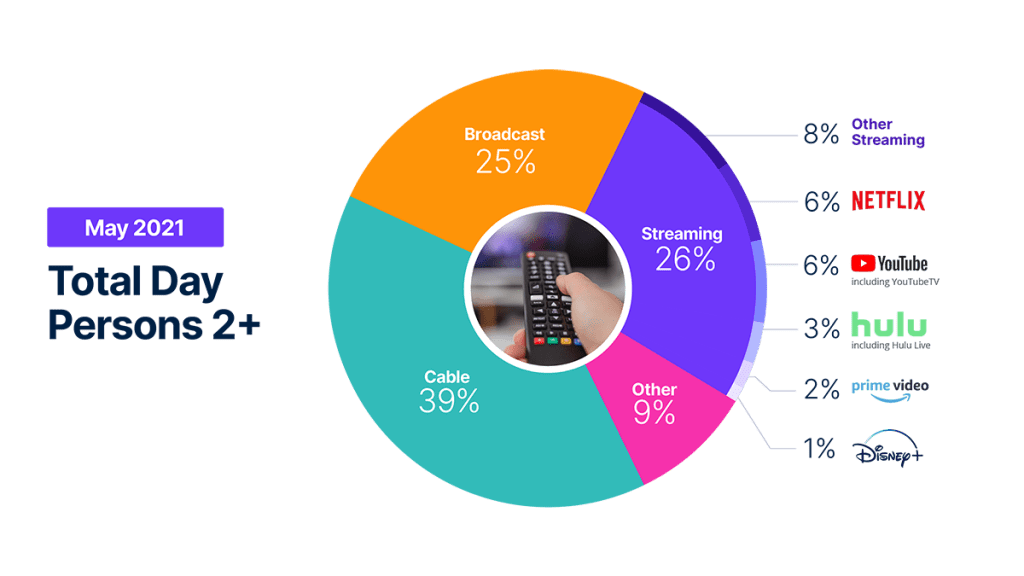
The Gauge 、放送、ストリーミング、ケーブル、その他のソースを含む主要なテレビ配信プラットフォームにおいて、消費者がどのようにコンテンツにアクセスしているかを月次でマクロ分析したものである。また、主要な個別ストリーミング配信事業者の内訳も掲載している。チャート自体は、各ストリーミング配信事業者のカテゴリー別シェアとテレビ利用全体のシェアを示している。
The Gauge データは、2つのパネルから別々に加重平均されたものであり、それを組み合わせてグラフを作成している。ニールセンのストリーミングデータは、全米TVパネル内のStreaming Meter対応TV世帯のサブセットに基づいている。リニアTVソース(放送とケーブル)と総使用量は、ニールセンのTVパネル全体の視聴に基づいている。
All the data is based on a specific time period for each viewing source. The data, representing a 5 week month, includes a combination of Live+7 for weeks 1 – 4 in the data time period. (Note: Live+7 includes live television viewing plus viewing up to seven days later. Live +3 includes television viewing plus viewing up to three days later.)
The Gauge「その他」には、その他のすべてのテレビが含まれる。これには主に、その他のチューニング(未測定ソース)、未測定のビデオ・オン・デマンド(VOD)、ケーブル・セット・トップ・ボックス経由のストリーミング、ゲーム、その他のデバイス(DVD再生)の利用が含まれる。ケーブルセットトップボックス経由のストリーミングは、各ストリーミング配信事業者をクレジットしていないため、「その他」に含まれる。ケーブル・セット・トップ・ボックス経由のストリーミングでは、各ストリーミング配信事業者がクレジットされていないため、これらは「その他」のカテゴリーに含まれています。
その他のストリーミング」として記載されているストリーミングプラットフォームには、個別に区分されていないテレビでの広帯域ビデオストリーミングが含まれる。
Yes, Hulu includes viewing on Hulu Live and Youtube includes viewing on Youtube TV.
エンコードされたライブTV、別名エンコードされたリニアストリーミングは、放送とケーブルの両グループ(リニアTV)に含まれるほか、ストリーミングとその他のストリーミング(Hulu Live、Youtube TV、その他のストリーミングMVPD/vMVPDアプリなど)にも含まれる。(注:MVPD(Multichannel Video Programming Distributor)は、複数のテレビチャンネルを提供するサービス。vMVPDは、主要な番組ネットワークからライセンスを受けたリニア(テレビ)コンテンツを集約し、スタンドアロンのサブスクリプション形式でパッケージ化し、ブロードバンド接続のあるデバイスからアクセスできるようにした配信事業者である)