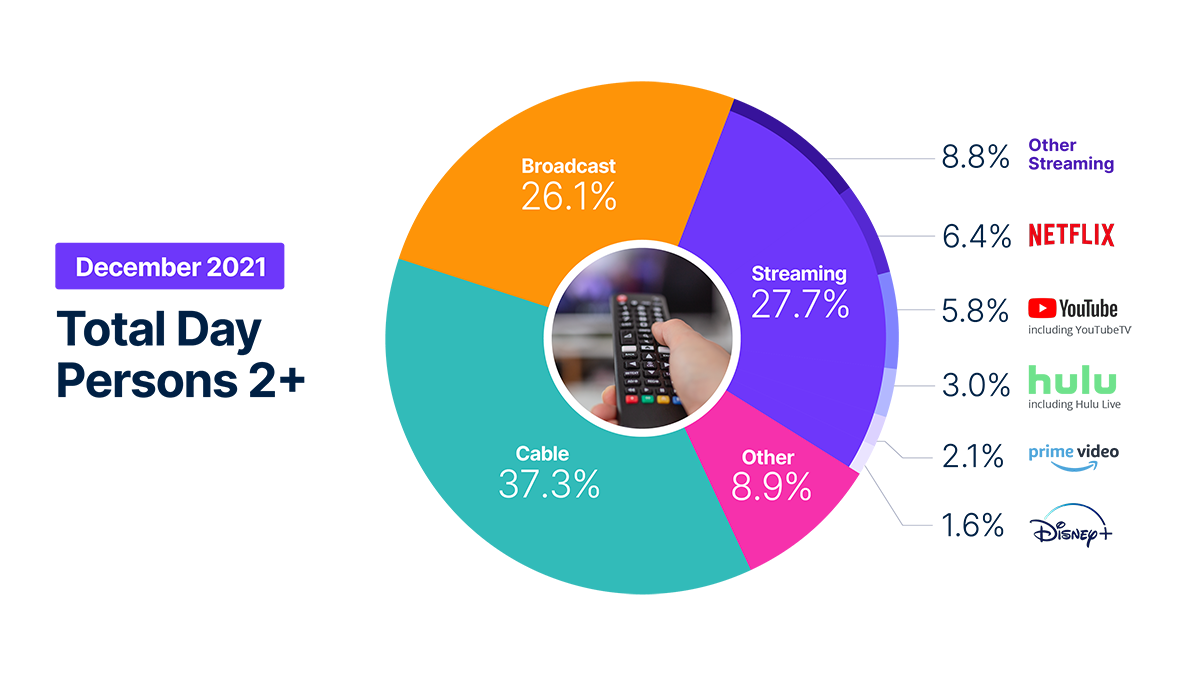
From a total viewing perspective, streaming was the clear outlier during the week of Christmas, as Americans watched a total of 183 billion minutes – an all-time high – across the growing range of over-the-top platforms. The aggregate viewing was enough to easily dethrone the 160 billion minutes watched during March 2020 (when stay-at-home restrictions began in the U.S.), as well as the 178 billion minutes watched during the week of Thanksgiving just a month earlier. The spike in streaming viewing also gave streamers 33% viewing share of total TV viewing during the week of Christmas, which was the most as measured by Nielsen.
From a reporting standpoint, this month’s edition of The Gauge expands the granularity of the data we provide. Instead of rounding, we have expanded viewing share calculations to display an additional decimal of data. This additional data will make it easier to see month-to-month changes in viewing share. In December, broadcast viewing dropped one share point and the “other” category, which includes video on-demand content, cable set top box streaming, gaming, and DVD usage, gained 1.6% share on the strength of video gaming, during what could be considered the “premiere season” in that category. Overall streaming was fairly flat for the month, remaining consistent with 28% share.


Obejrzyj wideo, aby usłyszeć, jak Brian Fuhrer, SVP, Product Strategy w Nielsen, przedstawia za kulisami niektóre zmiany w oglądalności, na których opiera się The Gauge.
METODOLOGIA I CZĘSTO ZADAWANE PYTANIA
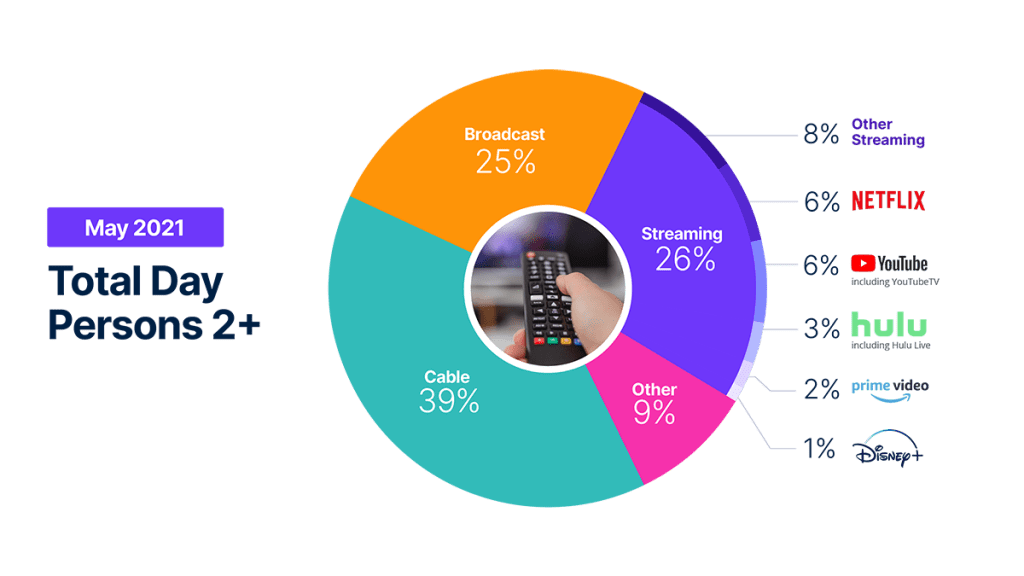
The Gauge zapewnia comiesięczną makroanalizę tego, w jaki sposób konsumenci uzyskują dostęp do treści na kluczowych platformach telewizyjnych, w tym nadawczych, strumieniowych, kablowych i innych źródłach. Obejmuje również podział głównych, indywidualnych dystrybutorów streamingu. Sam wykres pokazuje udział poszczególnych dystrybutorów w podziale na kategorie i całkowite wykorzystanie telewizji.
Dane dla The Gauge pochodzą z dwóch oddzielnie ważonych paneli i są łączone w celu utworzenia grafiki. Dane streamingowe Nielsena pochodzą z podzbioru gospodarstw domowych obsługujących Streaming Meter w ramach panelu National TV. Liniowe źródła telewizyjne (nadawane i kablowe), a także całkowite wykorzystanie są oparte na oglądaniu z ogólnego panelu telewizyjnego Nielsena.
All the data is based on a specific time period for each viewing source. The data, representing a 5 week month, includes a combination of Live+7 for weeks 1 – 4 in the data time period. (Note: Live+7 includes live television viewing plus viewing up to seven days later. Live +3 includes television viewing plus viewing up to three days later.)
W ramach The Gauge"Inne" obejmuje wszystkie inne programy telewizyjne. Obejmuje to przede wszystkim wszystkie inne tuningi (niezmierzone źródła), niezmierzone wideo na żądanie (VOD), przesyłanie strumieniowe za pośrednictwem dekodera telewizji kablowej, gry i inne urządzenia (odtwarzanie DVD). Ponieważ streaming za pośrednictwem dekoderów telewizji kablowej nie uwzględnia odpowiednich dystrybutorów streamingu, są one uwzględnione w kategorii "Inne". Uznanie poszczególnych dystrybutorów transmisji strumieniowych z dekoderów telewizji kablowej jest czymś, do czego Nielsen nadal dąży w miarę ulepszania naszej technologii Streaming Meter.
Platformy streamingowe wymienione jako "Inne transmisje strumieniowe" obejmują wszelkie transmisje strumieniowe wideo o wysokiej przepustowości w telewizji, które nie są indywidualnie podzielone.
Tak, Hulu obejmuje oglądanie w Hulu Live, a Youtube obejmuje oglądanie w Youtube TV.
Kodowana telewizja na żywo, czyli kodowana linearna transmisja strumieniowa, jest uwzględniona zarówno w grupach Broadcast i Cable (telewizja linearna), jak i w Streaming i inne transmisje strumieniowe, np. aplikacje Hulu Live, Youtube TV, Other Streaming MVPD/vMVPD. (Uwaga: MVPD lub wielokanałowy dystrybutor programów wideo to usługa, która zapewnia wiele kanałów telewizyjnych. vMVPD to dystrybutorzy, którzy agregują treści linearne (telewizyjne) licencjonowane od głównych sieci programistycznych i pakowane razem w samodzielny format subskrypcji i dostępne na urządzeniach z połączeniem szerokopasmowym).