From a total viewing perspective, streaming was the clear outlier during the week of Christmas, as Americans watched a total of 183 billion minutes – an all-time high – across the growing range of over-the-top platforms. The aggregate viewing was enough to easily dethrone the 160 billion minutes watched during March 2020 (when stay-at-home restrictions began in the U.S.), as well as the 178 billion minutes watched during the week of Thanksgiving just a month earlier. The spike in streaming viewing also gave streamers 33% viewing share of total TV viewing during the week of Christmas, which was the most as measured by Nielsen.
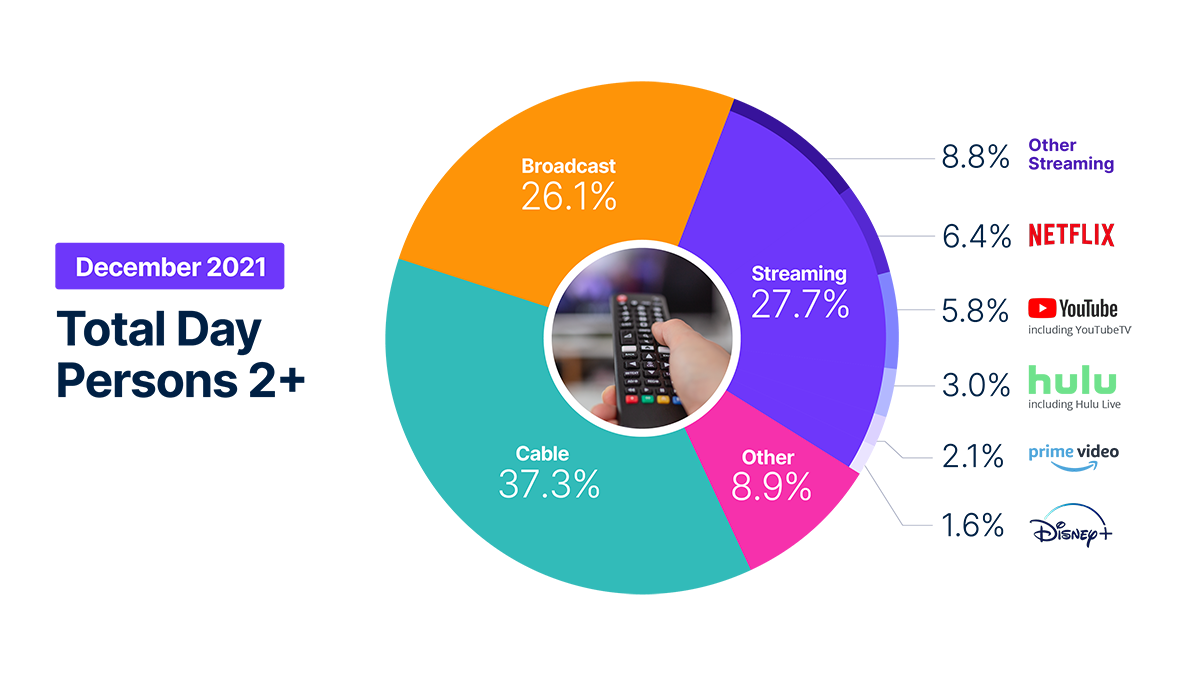
From a reporting standpoint, this month’s edition of The Gauge expands the granularity of the data we provide. Instead of rounding, we have expanded viewing share calculations to display an additional decimal of data. This additional data will make it easier to see month-to-month changes in viewing share. In December, broadcast viewing dropped one share point and the “other” category, which includes video on-demand content, cable set top box streaming, gaming, and DVD usage, gained 1.6% share on the strength of video gaming, during what could be considered the “premiere season” in that category. Overall streaming was fairly flat for the month, remaining consistent with 28% share.


ชมวิดีโอเพื่อฟัง Brian Fuhrer รองประธานอาวุโสฝ่ายกลยุทธ์ผลิตภัณฑ์ที่ Nielsen นำเสนอเบื้องหลังการเปลี่ยนแปลงการรับชมบางส่วนที่อยู่เบื้องหลัง The Gauge -
วิธีการและคำถามที่พบบ่อย
The Gauge นำเสนอการวิเคราะห์เชิงมหภาครายเดือนเกี่ยวกับวิธีที่ผู้บริโภคเข้าถึงเนื้อหาผ่านแพลตฟอร์มการส่งโทรทัศน์หลักๆ รวมถึงช่องทางการออกอากาศ สตรีมมิ่ง เคเบิล และแหล่งอื่นๆ นอกจากนี้ยังมีการแยกย่อยของผู้จัดจำหน่ายสตรีมมิ่งรายบุคคลรายใหญ่ แผนภูมิแสดงส่วนแบ่งตามหมวดหมู่และการใช้งานโทรทัศน์ทั้งหมดโดยผู้จัดจำหน่ายสตรีมมิ่งรายบุคคล
ข้อมูลสำหรับ The Gauge ได้มาจากแผงข้อมูลสองแผงที่ถ่วงน้ำหนักแยกกันและนำมารวมกันเพื่อสร้างกราฟิค ข้อมูลสตรีมมิ่งของ Nielsen ได้มาจากกลุ่มย่อยของครัวเรือนที่มีทีวีที่เปิดใช้งาน Streaming Meter ภายในแผงข้อมูลทีวีแห่งชาติ แหล่งที่มาของทีวีเชิงเส้น (บรอดคาสต์และเคเบิล) เช่นเดียวกับการใช้งานทั้งหมดนั้นอิงจากการรับชมจากแผงข้อมูลทีวีโดยรวมของ Nielsen
All the data is based on a specific time period for each viewing source. The data, representing a 5 week month, includes a combination of Live+7 for weeks 1 – 4 in the data time period. (Note: Live+7 includes live television viewing plus viewing up to seven days later. Live +3 includes television viewing plus viewing up to three days later.)
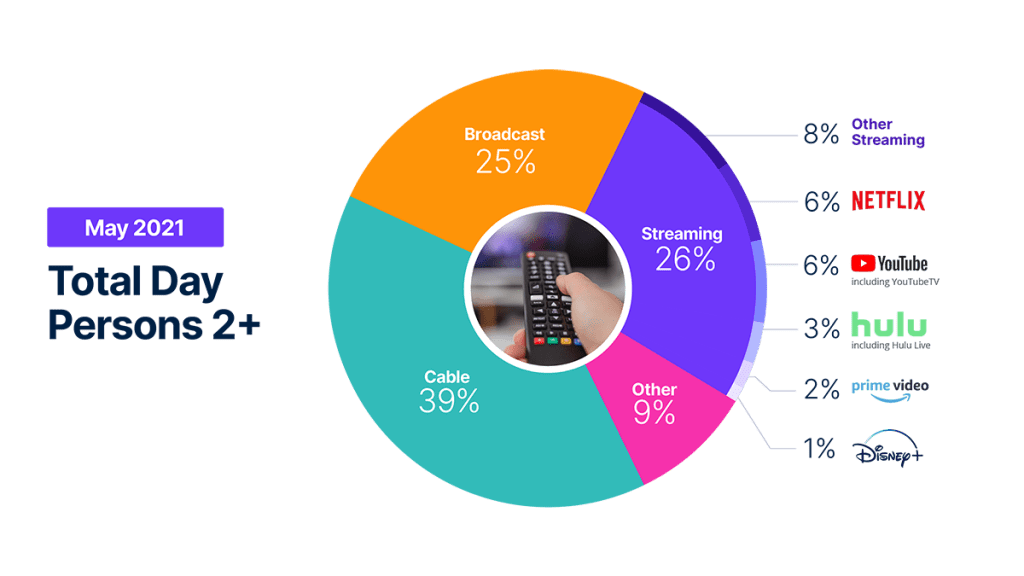
ภายใน The Gauge “อื่นๆ” รวมถึงทีวีอื่นๆ ทั้งหมด โดยหลักแล้วจะรวมถึงการปรับจูนอื่นๆ ทั้งหมด (แหล่งที่มาที่ไม่ได้วัด) วิดีโอออนดีมานด์ที่ไม่ได้วัด (VOD) การสตรีมผ่านกล่องรับสัญญาณเคเบิล การเล่นเกม และการใช้อุปกรณ์อื่นๆ (การเล่นดีวีดี) เนื่องจากการสตรีมผ่านกล่องรับสัญญาณเคเบิลจะไม่ให้เครดิตผู้จัดจำหน่ายสตรีมมิ่งที่เกี่ยวข้อง จึงรวมอยู่ในหมวดหมู่ “อื่นๆ” การให้เครดิตผู้จัดจำหน่ายสตรีมมิ่งแต่ละรายจากกล่องรับสัญญาณเคเบิลเป็นสิ่งที่ Nielsen ยังคงดำเนินการต่อไปในขณะที่เราปรับปรุงเทคโนโลยี Streaming Meter ของเรา
แพลตฟอร์มสตรีมมิ่งที่แสดงรายการว่าเป็น "สตรีมมิ่งอื่น ๆ" รวมถึงการสตรีมมิ่งวิดีโอแบนด์วิดท์สูงบนโทรทัศน์ที่ไม่ได้แยกรายละเอียดออกไป
ใช่ Hulu รวมถึงการรับชมบน Hulu Live และ Youtube รวมถึงการรับชมบน Youtube TV
Encoded Live TV หรือที่เรียกว่าการสตรีมมิงเชิงเส้นแบบเข้ารหัสนั้นรวมอยู่ในกลุ่มบรอดคาสต์และกลุ่มเคเบิล (ทีวีเชิงเส้น) เช่นเดียวกับกลุ่มสตรีมมิ่งและการสตรีมมิงอื่นๆ เช่น Hulu Live, Youtube TV และแอป MVPD/vMVPD สำหรับการสตรีมอื่นๆ (หมายเหตุ: MVPD หรือผู้จัดจำหน่ายโปรแกรมวิดีโอหลายช่องเป็นบริการที่ให้บริการช่องโทรทัศน์หลายช่อง vMVPD คือผู้จัดจำหน่ายที่รวบรวมเนื้อหาเชิงเส้น (ทีวี) ที่ได้รับอนุญาตจากเครือข่ายโปรแกรมหลักและจัดแพ็คเกจไว้ด้วยกันในรูปแบบสมัครสมาชิกแบบสแตนด์อโลนและสามารถเข้าถึงได้บนอุปกรณ์ที่มีการเชื่อมต่อบรอดแบนด์)