Sydney - 3 marca 2025 r. - Nielsen Ad Intelnajbardziej kompleksowa australijska usługa monitorowania wydatków na reklamę, opublikowała dziś raport dotyczący wydatków na reklamę w 2024 r., ujawniając marki i sektory inwestujące najwięcej w media oraz kluczowe zmiany trendów rok do roku.
Dominowały handel detaliczny, żywność i telekomunikacja, podczas gdy instytucje finansowe i motoryzacja odnotowały znaczące wzrosty.
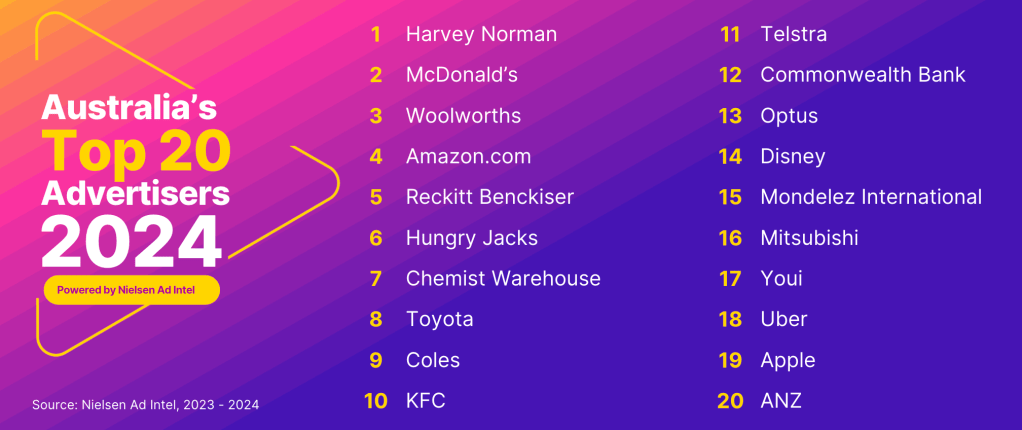
20 najlepszych reklamodawców w 2024 roku
1. Harvey Norman, 2. McDonald's, 3. Woolworths, 4. Amazon.com, 5. Reckitt Benckiser. 6. Hungry Jacks, 7. Chemist Warehouse, 8. Toyota, 9. Coles, 10. KFC, 11. Telstra, 12. Commonwealth Bank, 13. Optus, 14. Disney, 15. Mondelez International, 16. Mitsubishi, 17. Youi, 18. Uber, 19. Apple, 20. ANZ
Monique Perry, Nielsen Pacific MD powiedziała: "The Ad Intel na 2024 r. są dość wymowne - marketerzy nie tylko polegają na reklamie, ale ją forsują, ponieważ wiedzą, że działa. Wiedzą, że to wciąż najlepszy i najbardziej ekonomiczny sposób na budowanie trwałych więzi między markami a konsumentami. Kluczem są dane z najwyższej półki. To kluczowe, jeśli chcą uzyskać przewagę nad konkurencją. Rozbudowany pakiet danych Nielsena stał się niezbędny dla każdej marki, agencji, reklamodawcy lub marketera, który koncentruje się na wykorzystaniu danych, aby wyprzedzić konkurencję".
Rose Lopreiato, dyrektor handlowy Nielsen Ad Intelna region Pacyfiku, dodała: "Handel detaliczny pozostaje potęgą w zakresie wydatków na reklamę, wyprzedzając wszystkie inne sektory, ale motoryzacja również nadal rośnie. Na coraz bardziej konkurencyjnym rynku te spostrzeżenia są niezbędne, ponieważ reklamodawcy udoskonalają swoje strategie i skuteczniej alokują budżety. Nielsen Ad Intel pozostaje branżowym punktem odniesienia dla śledzenia trendów w inwestycjach reklamowych i zapewnia najbardziej przejrzysty i praktyczny wgląd w dynamiczny rynek reklamowy w Australii".
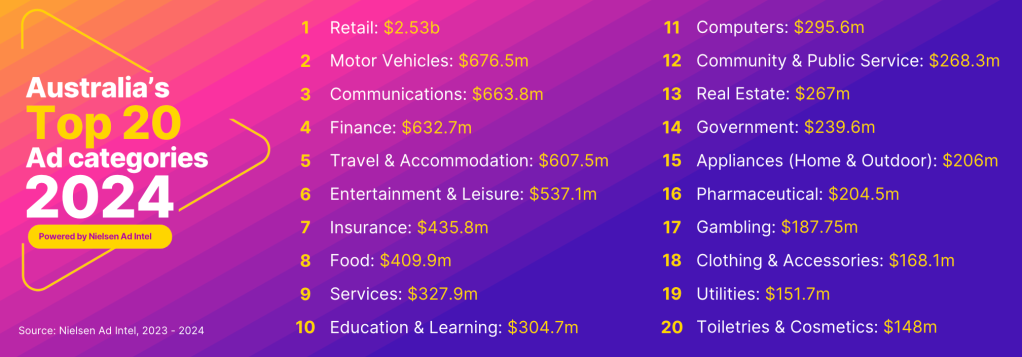
Kategorie reklamowe z największymi inwestycjami w 2024 r.
Pomimo presji ekonomicznej, reklamodawcy w Australii przeznaczyli znaczne budżety w różnych sektorach. Liderami były:
1. Sprzedaż detaliczna: 2,53 mld USD, 2. Pojazdy silnikowe: 676,5 mln USD, 3. Komunikacja: 663,8 mln USD, 4. Finanse: 632,7 mln USD, 5. Podróże i zakwaterowanie: 607,5 mln USD, 6. Rozrywka i wypoczynek: 537,1 mln USD, 7. Ubezpieczenia: 435,8 mln USD, 8. Żywność: 409,9 mln USD, 9. Usługi: 327,9 mln USD, 10. Edukacja i nauka: 304,7 mln USD
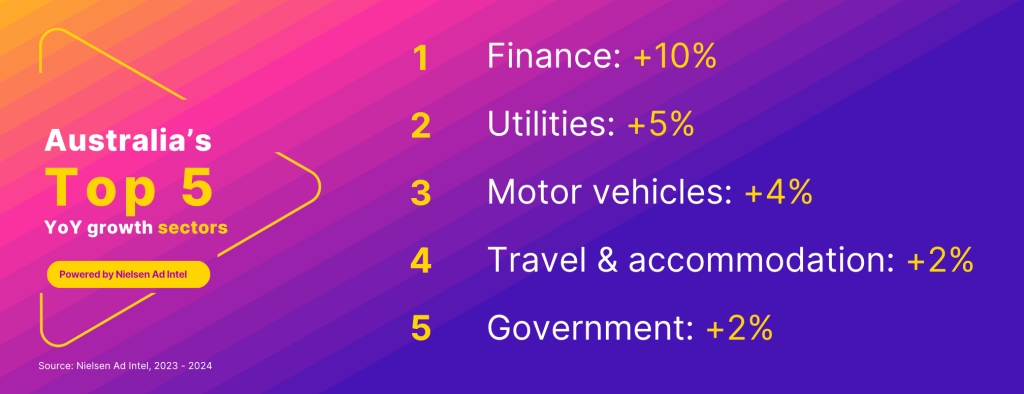
Top 5 sektorów z najwyższym wzrostem rok do roku
Inwestycje reklamowe odnotowały wzrost w wielu branżach w latach 2023-2024. Na czele znalazły się finanse z 10% wzrostem wydatków na reklamę. Przedsiębiorstwa użyteczności publicznej odnotowały wzrost o 5%, podczas gdy pojazdy silnikowe odnotowały wzrost o 4%, a zarówno podróże i zakwaterowanie, jak i rząd odnotowały skromny wzrost o 2%.
Reklama w sektorze rządowym ma szansę na większy wzrost w 2025 r. wraz z przyspieszeniem kampanii związanych z wyborami, zwłaszcza wyborami federalnymi i wyborami w stanie Waszyngton.
O firmie Nielsen
Nielsen jest światowym liderem w dziedzinie pomiarów oglądalności, danych i analiz. Dzięki naszemu zrozumieniu ludzi i ich zachowań we wszystkich kanałach i platformach, zapewniamy naszym klientom niezależne i praktyczne informacje, dzięki którym mogą łączyć się i angażować ze swoimi globalnymi odbiorcami - teraz i w przyszłości. Więcej informacji można znaleźć na stronie www.nielsen.com i w mediach społecznościowych (X, LinkedIn, YouTube, Facebook i Instagram).
Informacje o Nielsen Ad Intel
Ad Intel zapewnia najbardziej kompletne źródło wieloplatformowych informacji reklamowych dostępnych obecnie na rynku. Intuicyjne oprogramowanie umożliwia przeglądanie i porównywanie aktywności reklamowej w różnych mediach, firmach, kategoriach lub markach, a także danych historycznych.
Uwaga: Nielsen monitoruje wydatki reklamowe brutto w głównych mediach według opublikowanych wartości stawek. Niektórzy właściciele mediów udzielają rabatów, ale stawki nie są jawnie dostępne. Należy również pamiętać, że dane dotyczące kategorii i grup marek/produktów są grupowane według uznania firmy Nielsen.
Kontakt dla prasy
Dan Chapman
dan.chapman@nielsen.com
+61 4040884
