There is no mistaking the impact of connectivity on how audiences are watching TV. In just the past five years, the number of households in the U.S. that get their TV content from an internet connection has increased by more than 210%1. The allure of an internet’s worth of content notwithstanding, a smaller, yet consistent, portion of TV homes continue to thrive on the over-the-air (OTA) broadcast programming they access for free using digital antennas—even when more than 70% of homes now have at least one smart TV2.
Nielsen’s 2024 Upfronts/NewFronts Guide revealed that, as of November 2023, more than 18% of U.S. TV households had at least one TV set enabled to receive free, broadcast programming. Given the many content options available to audiences, however, few homes rely solely on their digital antennas for TV content. Most complement their OTA access with content they can access from other sources. Sixty percent, for example, subscribe to a streaming video-on-demand service. The same is true of households that have cable or satellite services: In fact, nearly 4% have at least one OTA-enabled TV set.
While the way in which audiences access TV content continues to evolve, the concentration of OTA homes has remained consistent over the past five years. OTA homes represented 14.5% of U.S. TV households3 in third-quarter 2023.
Konsistensi akses pemrograman OTA, termasuk penggunaan distributor pemrograman video multisaluran virtual (vMVPD; misalnya, Hulu Live, YouTube TV, Sling TV), menyoroti keterlibatan pemirsa TV yang terus berlanjut dengan pemrograman linier tradisional. Faktanya, sekitar 92% rumah tangga TV, terlepas dari klasifikasinya, menonton beberapa bentuk pemrograman linier antara Oktober 2022 dan Oktober 2023.
Sekitar 92% dari rumah TV menonton beberapa bentuk pemrograman linier
In addition to highlighting the consistent appeal of traditional broadcast programming, the steadfast portion of homes that access this content with digital antennas is a critical audience measurement consideration, especially as big data gains momentum as a measurement source amid rising connected TV (CTV)4 usage.
With CTV usage accounting for just over 32% of TV usage among adults 18 and older5, it makes sense that companies are looking to leverage the data from smart TVs and set-top-boxes from multichannel video programming distributors (MVPDs; e.g., DirecTV, Cox, Comcast Xfinity, DISH). We know that these data sources can advance the science of audience measurement, but they don’t capture OTA viewing.
Big data dapat memajukan ilmu pengukuran audiens, tetapi tidak dapat menangkap penayangan OTA
Menurut perkiraan dunia TV Nielsen untuk tahun 2023-24, AS memiliki 125 juta rumah tangga TV, naik 1% dari tahun sebelumnya. Ini berarti bahwa hanya kurang dari 97% rumah tangga di AS memiliki setidaknya satu TV yang digunakan untuk menonton acara. Rumah tangga ini adalah rumah bagi hampir 315,3 juta orang.
Hampir 23 juta rumah di Amerika Serikat mengakses program TV gratis dengan menggunakan antena digital
Di dalam jagat rumah tangga TV, 18,125 juta adalah rumah tangga OTA, dan 4,625 juta lainnya adalah rumah TV kabel dan satelit yang juga memiliki perangkat TV berkemampuan OTA. Secara keseluruhan, 22,750 juta rumah tangga mengakses konten TV melalui antena OTA-perangkat yang berada di luar cakupan pengumpulan data besar.
Keterlibatan yang konsisten dan signifikan dengan pemrograman linier penting karena dua alasan:
- Sebagian besar TV di rumah terus menonton program tradisional yang didukung iklan.
- Sumber data besar saja tidak dapat memberikan wawasan tentang perilaku menonton jutaan pemirsa yang menonton TV menggunakan antena digital.
Di luar rata-rata nasional, penggunaan OTA memainkan peran yang jauh lebih besar di kota-kota tertentu. Di Houston, misalnya, lebih dari 27% rumah memiliki setidaknya satu perangkat TV yang dapat menerima program siaran gratis, dengan hampir 24% menggunakan antena sebagai sarana utama untuk menonton TV. Persentase penggunaan OTA bahkan melebihi 30% di area pasar tertentu (DMA), dengan Oklahoma City menduduki peringkat teratas: 37,3% rumah TV di pasar ini memiliki setidaknya satu perangkat TV berkemampuan OTA.
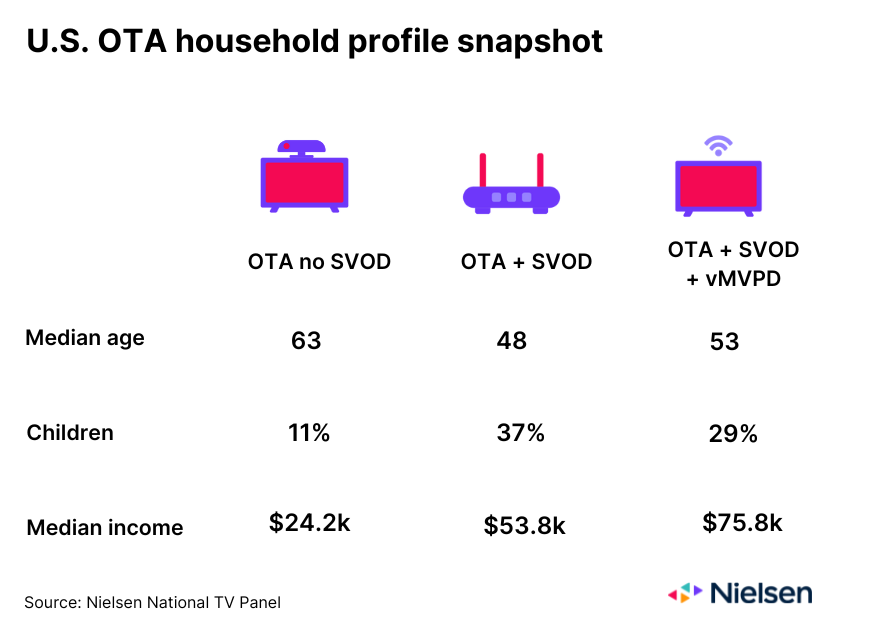
Combined with person-level demographic information from Nielsen’s National TV panel, OTA audience data provides advertisers and agencies with insight that’s out of reach of big data. Nearly 60% of OTA households that don’t subscribe to a subscription video on demand (SVOD) service, for example, are households of one person, while 45% of OTA households that subscribe to an SVOD service but don’t use a vMVPD are home to three or more people. From an income perspective, however, OTA households that subscribe to an SVOD service and use a vMVPD are the biggest earners.
Peningkatan konektivitas di antara pemirsa terus memainkan peran penting dalam cara pemirsa mengakses konten TV, namun program siaran OTA gratis tetap menjadi hal yang penting bagi hampir 20% rumah tangga TV di Amerika Serikat. Dari perspektif nilai, pengiklan dan agensi membutuhkan wawasan tentang hampir 23 juta pemirsa yang menyukai program ini - program yang berada di luar ranah yang dapat ditangkap oleh big data. Seiring dengan berkembangnya pengukuran pemirsa yang menyertakan data dari TV pintar dan kotak kabel, akan sangat penting bahwa orang, bukan data besar, tetap menjadi pusat dari persamaan.
Learn more about the power of big data and panel measurement here.
Sumber
1Nielsen National TV Panel; September 2019 vs. September 2023. This percentage reflects the increase in homes that stream TV content from the internet and/or access TV content through a vMVPD.
2Panel TV Nasional Nielsen; Oktober 2023
3This percentage includes homes that may have an vMVPD. Nielsen plans to reclassify homes with a vMVPD as Cable Plus homes in 2024.
4CTV refers to any television that accesses content from the internet. The most common use case is to stream video content.
5Nielsen National TV Panel; Q2 2023


