Find out who tops Nielsen’s Brand Sustainability Rankings for 2022
across 18 different industry categories*
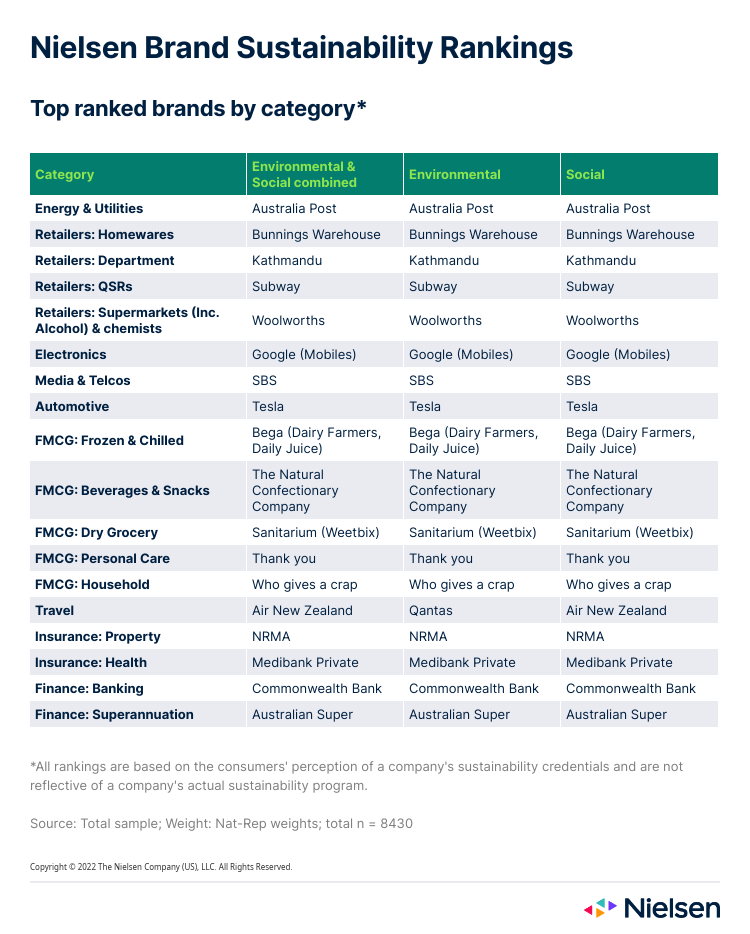
Sydney, 25 November 2022 – Nielsen today released its Brand Sustainability Rankings for 2022 – a survey of 8,430 Australian consumers to find out how they rank the sustainability credentials of 247 core brands across 18 categories, including media, travel, retail, and banking.
หมวดหมู่ทั้ง 18 หมวดหมู่ได้รับการจัดอันดับทางสังคม การจัดอันดับด้านสิ่งแวดล้อม และการจัดอันดับโดยรวม (ซึ่งเป็นการผสมผสานการจัดอันดับทางสังคมและสิ่งแวดล้อม) การจัดอันดับเหล่านี้เผยให้เห็นการรับรู้ของแบรนด์ผู้บริโภคในตัวชี้วัดความยั่งยืนที่สำคัญ มากกว่าสิ่งที่แบรนด์ต่างๆ กำลังทำอยู่ในตลาด*
Bunnings Warehouse ครองอันดับหนึ่งในหมวดผู้ค้าปลีกเครื่องใช้ในบ้านจากการจัดอันดับทั้งสามประเภท ส่วน Commonwealth Bank ก็ทำเช่นเดียวกัน โดยได้อันดับหนึ่งในการจัดอันดับด้านสังคม สิ่งแวดล้อม และโดยรวมสำหรับประเภทการธนาคาร นอกจากนี้ SBS ยังคว้าอันดับในการจัดอันดับทั้งสามประเภทสำหรับประเภทสื่อและโทรคมนาคมอีกด้วย
Qantas ครองอันดับหนึ่งในการจัดอันดับด้านสิ่งแวดล้อมสำหรับการเดินทาง ขณะที่ Air New Zealand ครองอันดับหนึ่งในหมวดการเดินทางในการจัดอันดับด้านสังคมและการจัดอันดับโดยรวม (การจัดอันดับด้านสิ่งแวดล้อมและสังคมรวมกัน)
Nielsen’s Brand Sustainability Rankings are a key component of its recently released Brand Sustainability Report, compiled with support from Dentsu, AANA, and EDGE Environment.
The 18 broad product categories in the rankings were selected based on their relevance to the Australian consumer market, including market share, prominence, and information from Nielsen’s Ad Intel and Consumer & Media View (CMV).
เพื่อรักษาความเป็นอิสระ ไม่มีบริษัทใดเข้ามาเกี่ยวข้องในกระบวนการคัดเลือก และไม่มีทางเลือกที่จะถูกคัดออก
To help consumers associate the relevant brand with the relevant organisation, where the company name is not directly associated with a brand, both the company name and brand name were shown together (e.g. Unilever’s brands were shown as Unilever – Ben & Jerry’s, Streets in the Frozen & Chilled category).
ค้นหาข้อมูลเพิ่มเติมเกี่ยวกับการจัดอันดับความยั่งยืนของแบรนด์และรายงานของ NIELSEN
NOTE: *All rankings are based on the consumers’ perception of a company’s sustainability credentials and are not reflective of a company’s actual sustainability program. See below for more information and for the ranking methodology.
#จบ#
เกี่ยวกับรายงานความยั่งยืนของแบรนด์ของ Nielsen
หมวดหมู่และแบรนด์
Consumers were randomly assigned two categories to assess separately. For each category, they were asked to rank the environmental and social factors in order of importance to that specific category, with factors presented in random order. Subsequently, they were then asked to rate each of the brands against the top three environmental and social factors (brands were also presented in random order). These scores were then combined to form the rankings.
Brand ranking methodology
Both environmental and social sustainability were important areas for consideration in this research due to the macro yet nuanced nature of sustainability to consumers.
As such it’s not always a level playing field across all categories. For example, it’s more challenging for service-based categories to drive notable positive environmental change compared to categories that sell physical products which is why Social sustainability needs to be a key consideration.
While consumers increasingly view their consumption habits through a sustainability lens, their perspectives may shift depending on the situation. As important as the topic of sustainability is, it’s still one of several factors in a consumer’s decision-making process.
สิ่งสำคัญประการหนึ่งคือแบรนด์ต่างๆ จะต้องไม่พิจารณาเฉพาะพฤติกรรมของตนเองเท่านั้น แต่จะต้องพิจารณาพฤติกรรมของแบรนด์อื่นๆ ในหมวดหมู่ด้วย เนื่องจากแบรนด์ต่างๆ ในกลุ่มนี้มีทั้งผลดีและผลเสีย ดังนั้น จึงถึงเวลาแล้วที่ต้องพิจารณาถึงหมวดหมู่ในแง่ของความยั่งยืน
The process for determining a brand’s sustainability ranking* followed four broad steps.
Step 1.
Consumers were presented with a category and asked to rank various sustainability statements in order of importance when considering that specific category. This ranking allowed Nielsen to create weights for each statement, based on relevance.
Step 2.
Consumers were asked to score all brands within a category on their perceived delivery against their top three ranked statements.
Step 3.
Advanced statistical techniques were used to combine the statement weighting with the brand score for all brands within the category.
Step 4.
All data was combined to produce a ranking across categories.
Nielsen Brand Sustainability Rankings
Consumers rated brands across environmental and social sustainability factors, which were calculated in combination to provide an overall brand ranking.
จากนั้นคะแนนเหล่านี้จะถูกนำมารวมกันเพื่อสร้างการจัดอันดับ ควรสังเกตว่าควรใช้มุมมองแบบองค์รวมในการประเมินการจัดอันดับเหล่านี้ โดยความแตกต่างระหว่างสองแบรนด์ที่อยู่ในอันดับใกล้เคียงกัน (เช่น น้อยกว่าห้าอันดับ) ไม่ควรถือเป็นความแตกต่างทางสถิติ อย่างไรก็ตาม แบรนด์ที่ได้รับอันดับดีกว่าคู่แข่งประมาณ 20 อันดับจะบ่งบอกถึงการรับรู้ของตลาดที่ดีกว่ามาก
เกี่ยวกับนีลเส็น
Nielsen shapes the world’s media and content as a global leader in audience measurement, data and analytics. Through our understanding of people and their behaviours across all channels and platforms, we empower our clients with independent and actionable intelligence so they can connect and engage with their audiences – now and into the future. Nielsen operates around the world in more than 55 countries.
เรียนรู้เพิ่มเติมได้ที่ www.nielsen.com และเชื่อมต่อกับเราบนโซเชียลมีเดีย (Twitter, LinkedIn, Facebook และ Instagram)
ติดต่อสื่อมวลชน
แดน แชปแมน
Associate Director, Marketing & Communications,
Pacific, Nielsen
dan.chapman@nielsen.com
+61 404 088 462
