Zbliżając się do Międzynarodowego Dnia Osób Niepełnosprawnych 3 grudnia, marki, reklamodawcy i platformy medialne stają w obliczu zmieniającego się krajobrazu w zróżnicowanym marketingu. Wraz ze zmieniającą się dynamiką polityczną, gospodarczą i społeczną, zrozumienie odbiorców - w tym osób niepełnosprawnych - wymaga precyzji i niuansów. Jest to szczególnie prawdziwe, gdy weźmie się pod uwagę krzyżujące się tożsamości wielu osób. Przyjrzyjmy się oczekiwaniom, potrzebom i potencjałowi ekonomicznemu tej często pomijanej grupy, podkreślając strategiczną szansę dla marek na autentyczną i intersekcjonalną integrację.
Poruszanie się po nowym krajobrazie w zróżnicowanym marketingu
Niedawne wybory w Stanach Zjednoczonych uwypukliły rosnącą prawdę: nawiązanie kontaktu z odbiorcami oznacza wyjście poza powierzchowne dane demograficzne i zrozumienie złożonych, krzyżujących się tożsamości. Osoby niepełnosprawne nie tylko wnoszą unikalną perspektywę, ale także krzyżują się z innymi grupami, w tym różnymi rasami, płciami, orientacjami seksualnymi i środowiskami społeczno-ekonomicznymi. Na przykład młoda Latynoska z niepełnosprawnością fizyczną może mieć inne preferencje medialne i zachowania zakupowe niż starszy biały mężczyzna z niepełnosprawnością słuchu.
Marki, które potrafią wykorzystać precyzyjne, wielowymiarowe dane do łączenia się z tymi różnorodnymi doświadczeniami, mają dobrą pozycję do budowania znaczących relacji.
Reprezentacja ma większe znaczenie niż kiedykolwiek
Gaps in disability representation remain stark, especially when intersectionality is considered. Overall, disabled individuals make up 26% of the U.S. population, but represented only 5.9% of the time on TV screens in 2024—down from 6.8%1 last year. This disparity is even more pronounced with intersectional identities who belong to multiple marginalized groups; for example, people of color with any disability is represented 1.6% on TV in Q1 – Q3 20242.
Reprezentacja telewizyjna a udział w populacji
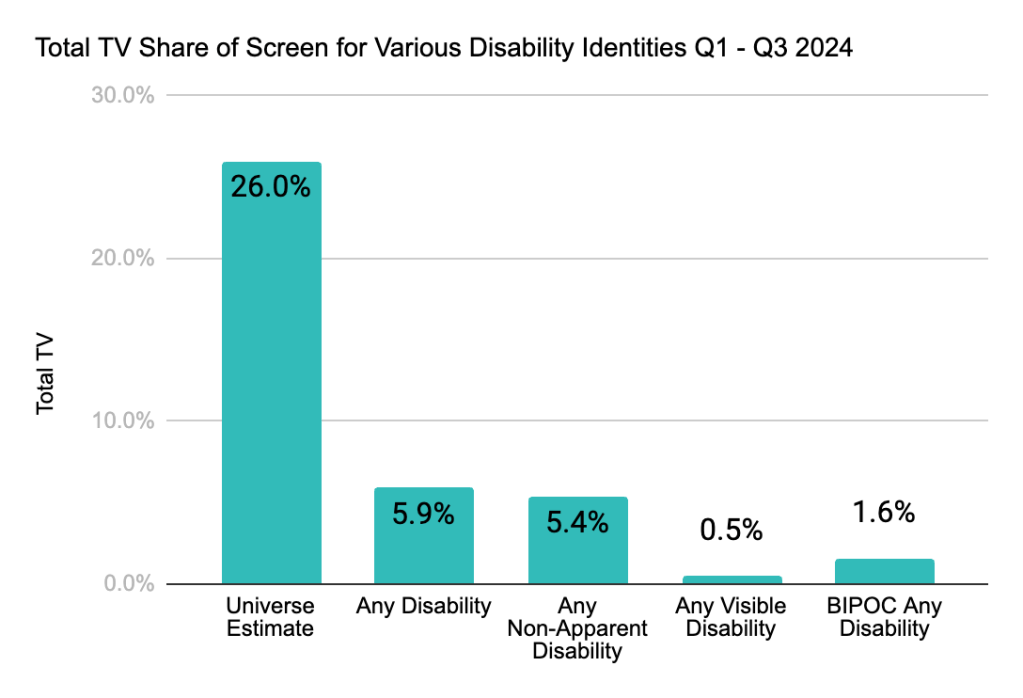
Source: Gracenote Inclusion Analytics, Q1 – Q3 2024
Copyright ©2024 The Nielsen Company (US), LLC. Wszelkie prawa zastrzeżone.
Zapotrzebowanie na autentyczność i trafność
Authenticity has become non-negotiable. Among people with disabilities, 52%3 wish for more representation of their identity group on television, with 50% feeling their identity is often misrepresented. This sentiment is even stronger among those who hold multiple marginalized identities—for example, 60% of Black women with disabilities report feeling misrepresented.
This is even more pronounced for people with mental health disabilities, where 54% report feeling misrepresented. Audiences are more likely to disengage from brands that fall short—61% say they would stop purchasing from brands that don’t respect their community. Misrepresentation doesn’t just alienate viewers; it can have tangible economic consequences for brands.
Osoby niepełnosprawne przestaną kupować od marek, które ich nie doceniają.
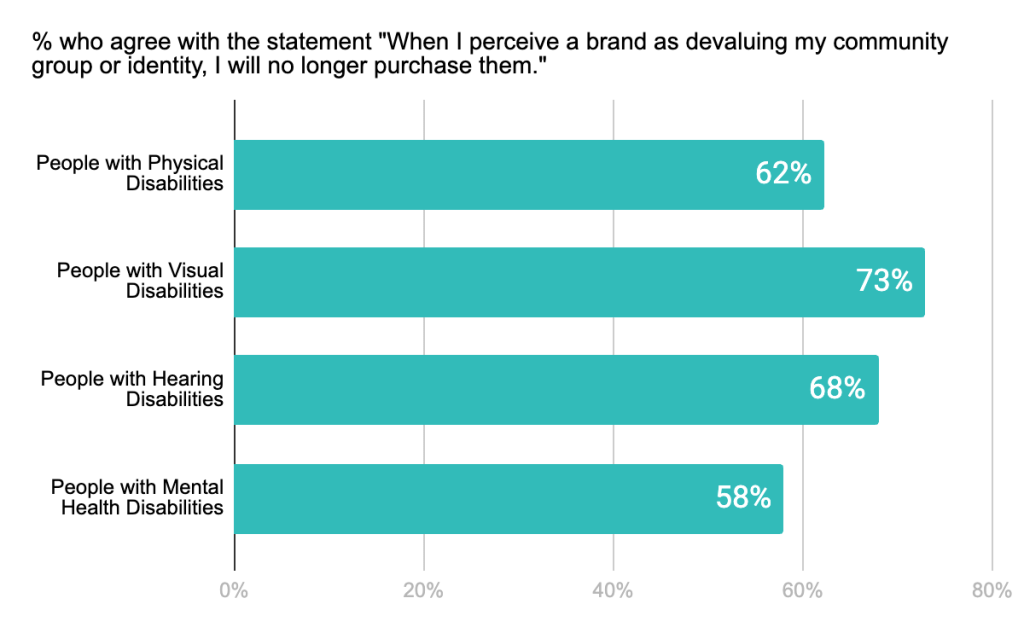
Źródło: Ankieta na temat reprezentacji 2023
Copyright ©2024 The Nielsen Company (US), LLC. Wszelkie prawa zastrzeżone.
Potężna szansa ekonomiczna
The U.S. disability community wields an estimated $490 billion in annual disposable income, influencing an extended market worth more than $1 trillion when considering friends and family4. Moreover, 63% of disabled individuals will consider seeking a new brand because they feel their current brand does not align with the causes they care about.4
People with disabilities are discerning consumers, with 52% expecting brands to support causes aligned with their community4. Brands that prioritize inclusion can tap into this significant market potential, leading to increased market share and customer loyalty. By backing relevant social initiatives and developing accessible, inclusive products and services, brands can see substantial returns on investment.
Łączenie się z odbiorcami tam, gdzie ma to znaczenie
Today’s audiences expect brands to meet them where they are. For disabled people, 70% report experiencing ads that don’t feel relevant to them, and 37% are likely to ignore ads that don’t reflect their identity group5. Irrelevant content drives disengagement. Brands can create ads that align with the real experiences and values of people with disabilities, considering the intersections of race, gender identity, age, and socioeconomic status.
“It is important to provide authentic representation of the communities they serve,” said Lauren Appelbaum, SVP of Entertainment & Media of Disability Belongs, one of Nielsen’s partners in disability inclusive marketing. “Just as important, brands can and should include disabled people in their ad campaigns even when the ad is not about disability.”
In a media landscape where digital is growing, local television remains a trusted choice for people with disabilities. 33% select it as their primary news source, and 62% place it among their top three.4 This preference is even more pronounced in certain subgroups—such as older adults and rural communities—highlighting the importance of understanding the nuanced media consumption habits within the disability community.
Nielsen’s local data allows brands to tailor their messaging to specific markets, ensuring relevance and resonance. By identifying the preferred channels and content of different segments within the disability community, brands can optimize their media planning for maximum impact.
Dostępność jako korzyść powszechna: efekt obniżenia krawężnika w działaniu
While accessibility features are essential for disabled people, their benefits extend to all viewers. Just as curb cuts designed for wheelchair users benefit parents with strollers, cyclists, and delivery workers, accessibility features in media offer advantages for everyone. A prime example is closed captioning. While crucial for viewers who are deaf and hard of hearing, a surprising 58% of all people use subtitles. Of these, 38% find it improves their comprehension of the content, and 26% use it to enjoy content in different languages3. When you approach accessibility features from a universal perspective, it enhances the viewing experience for all.
Wgląd w specyfikę branży i praktyczne strategie
Aby zwiększyć zaangażowanie osób niepełnosprawnych, marki powinny rozważyć następujące strategie:
- Invest in authentic representation: Collaborate with creators and talent from the disability community to ensure accurate and respectful portrayal.
- Leverage intersectional data: Use Nielsen’s multidimensional analytics to understand the overlapping identities of your target audience.
- Develop inclusive products and services: Prioritize accessibility in product design and service delivery to meet the needs of all consumers.
- Support relevant causes: Align with social initiatives and organizations that advocate for the disability community, reinforcing brand commitment to inclusion.
- Optimize media planning: Use data-driven insights to choose the right channels and times to reach your audience effectively.
"Poprzez przemyślane włączenie dostępności i reprezentacji do swoich planów biznesowych, marki integrujące osoby niepełnosprawne nie tylko tworzą bardziej integracyjne środowisko, ale także wspierają silniejsze relacje z różnymi odbiorcami" - powiedział Ariel Simms, prezes i dyrektor generalny Disability Belongs. "Marki, które od samego początku traktują priorytetowo integrację osób niepełnosprawnych, mogą czerpać korzyści z bardziej sprawiedliwego rynku".
By implementing these strategies, brands can enhance their media planning and advertising effectiveness, leading to better engagement and a stronger return on investment. As diverse marketing needs evolve, understanding the unique dimensions of disability representation isn’t just ethical, it’s essential for brands to stay relevant and competitive. The intersection of identity, relevance, and buying power presents a compelling opportunity for brands to create truly inclusive, meaningful connections with a powerful and loyal audience. Nielsen can provide the insights needed to navigate this evolving landscape and drive success through authentic inclusivity.
Źródła:
1 Gracenote Inclusion Analytics Q1-Q3 2024 and 2023
2 Gracenote Inclusion Analytics Q1-Q3 2024
3 2023 Attitudes on representation survey
4 American Institutes for Research report 2018
5 2024 Attitudes on advertising survey