Paramount Scores Largest Share Increase Among Distributors as Paramount+ and CBS Affiliates Each Surge More Than 18% in November
Netflix registra un aumento del 10%, trainato dai quasi 19 miliardi di minuti di visualizzazione di "Stranger Things", "The Beast In Me" e "Frankenstein".
Hallmark sfrutta la programmazione natalizia per ottenere un aumento del 28% degli ascolti
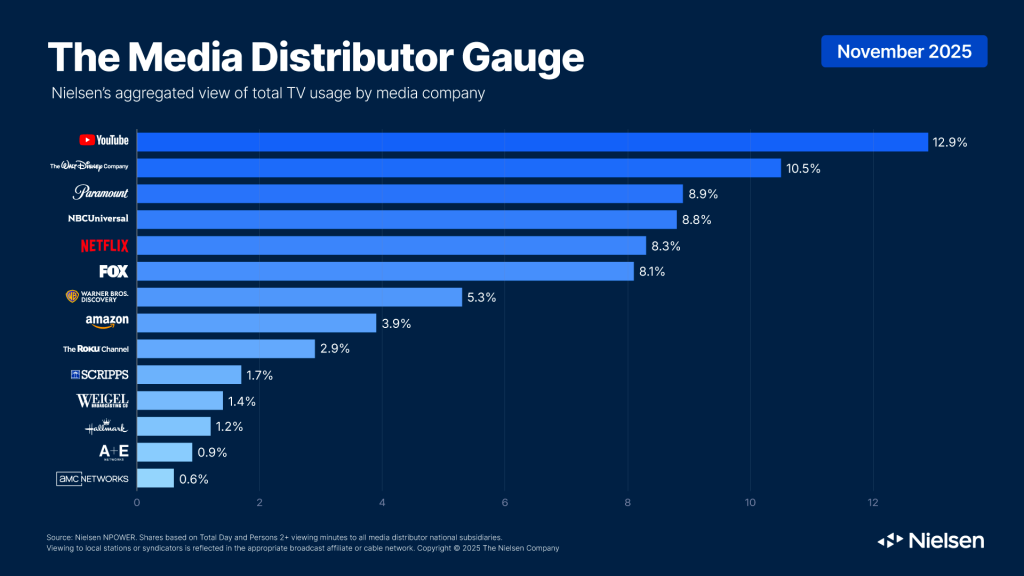
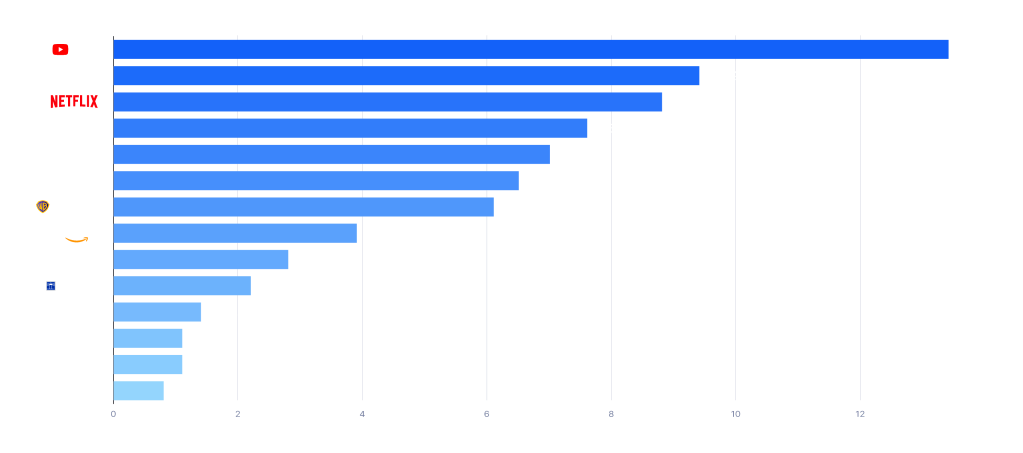
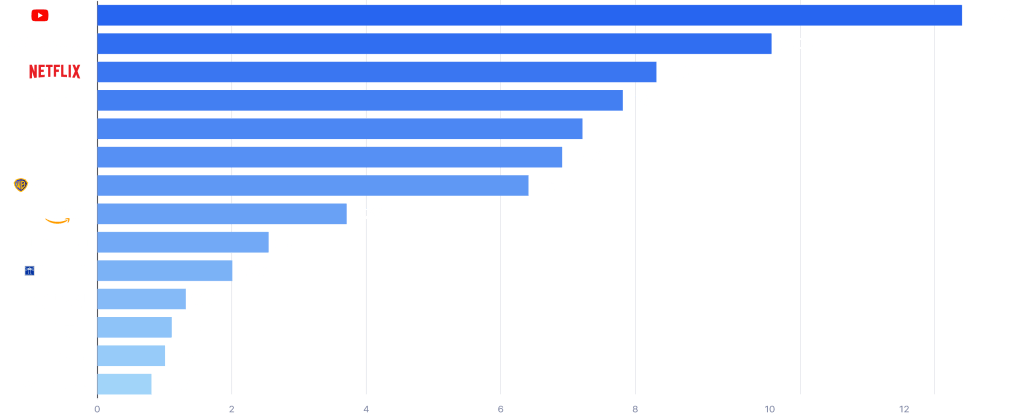
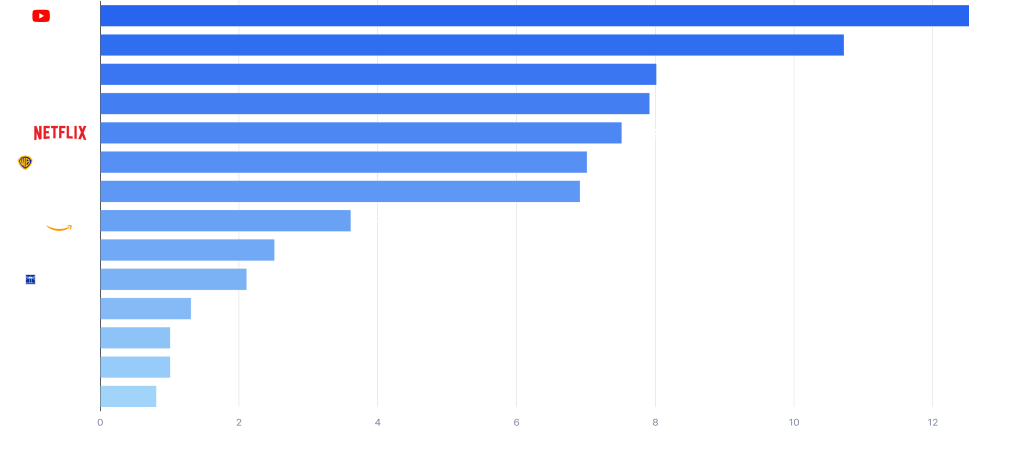
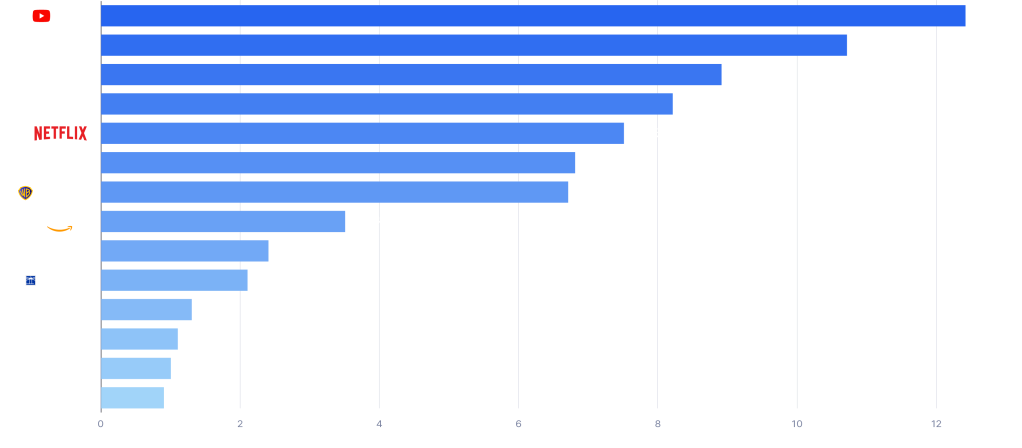
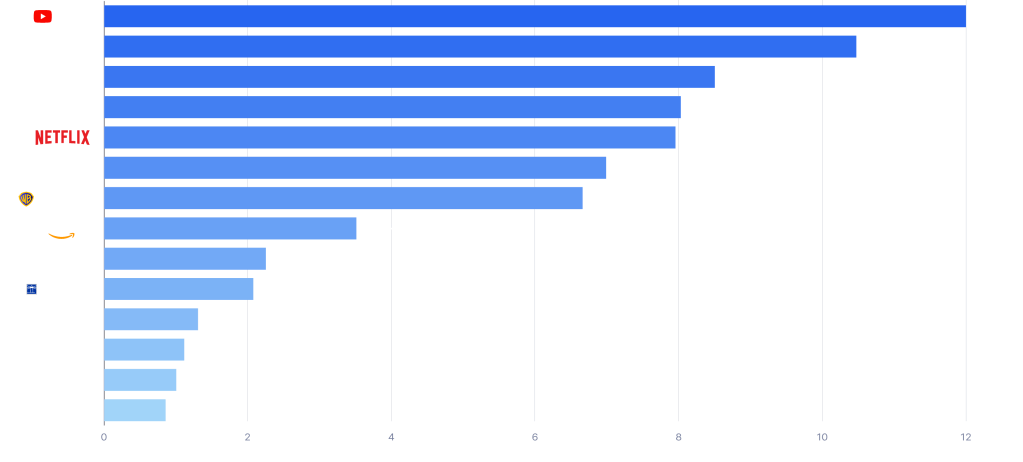
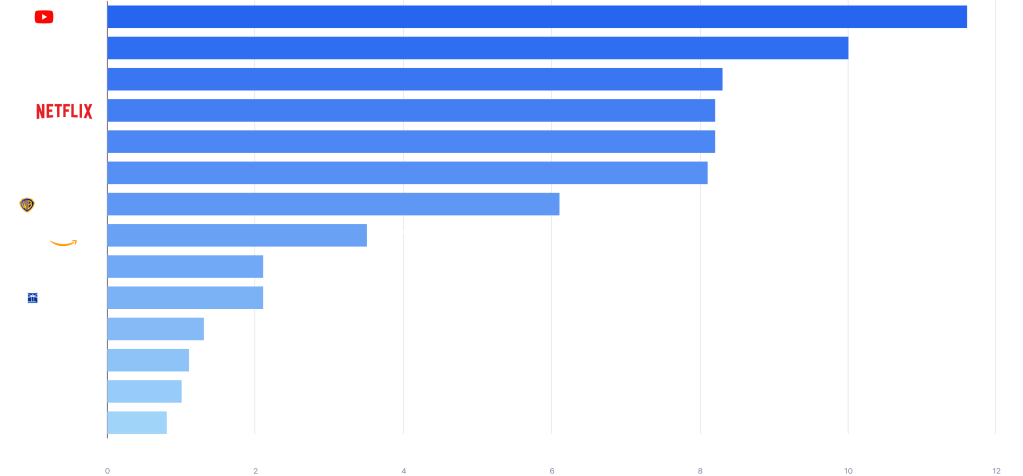
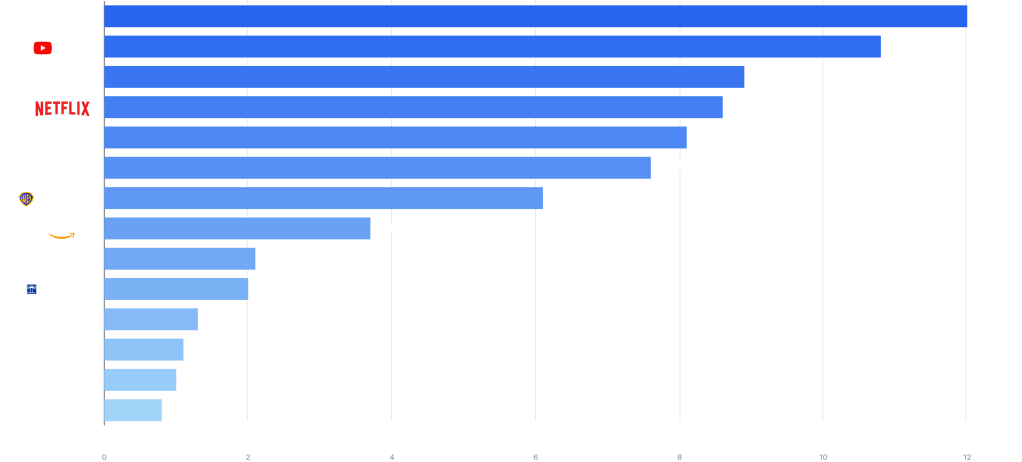
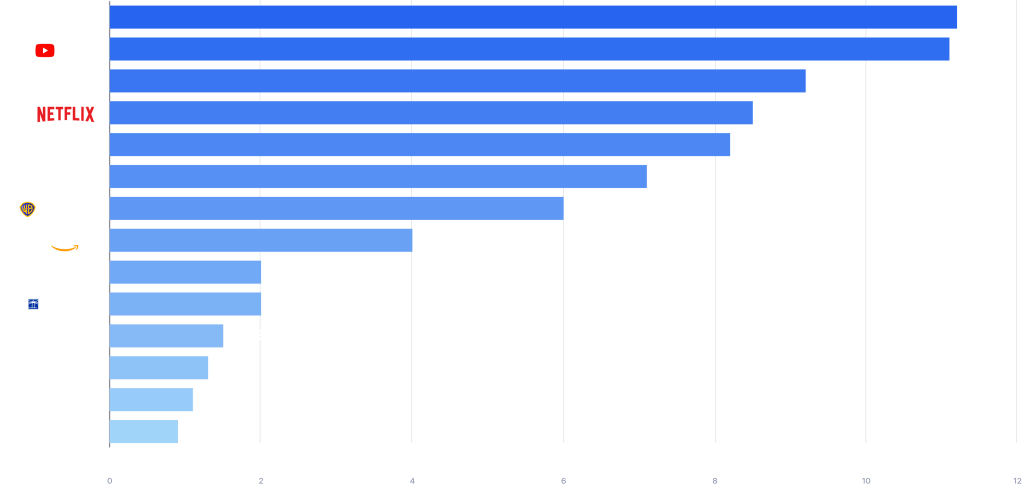
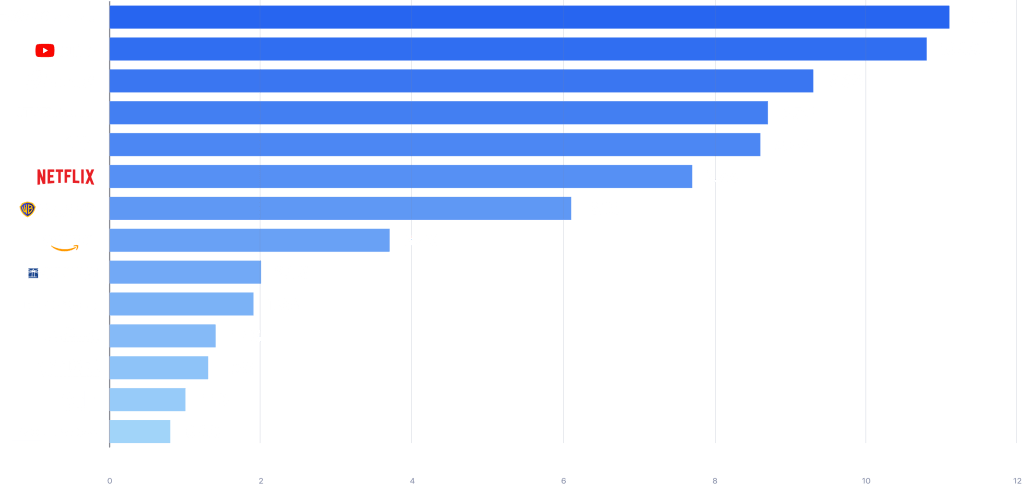
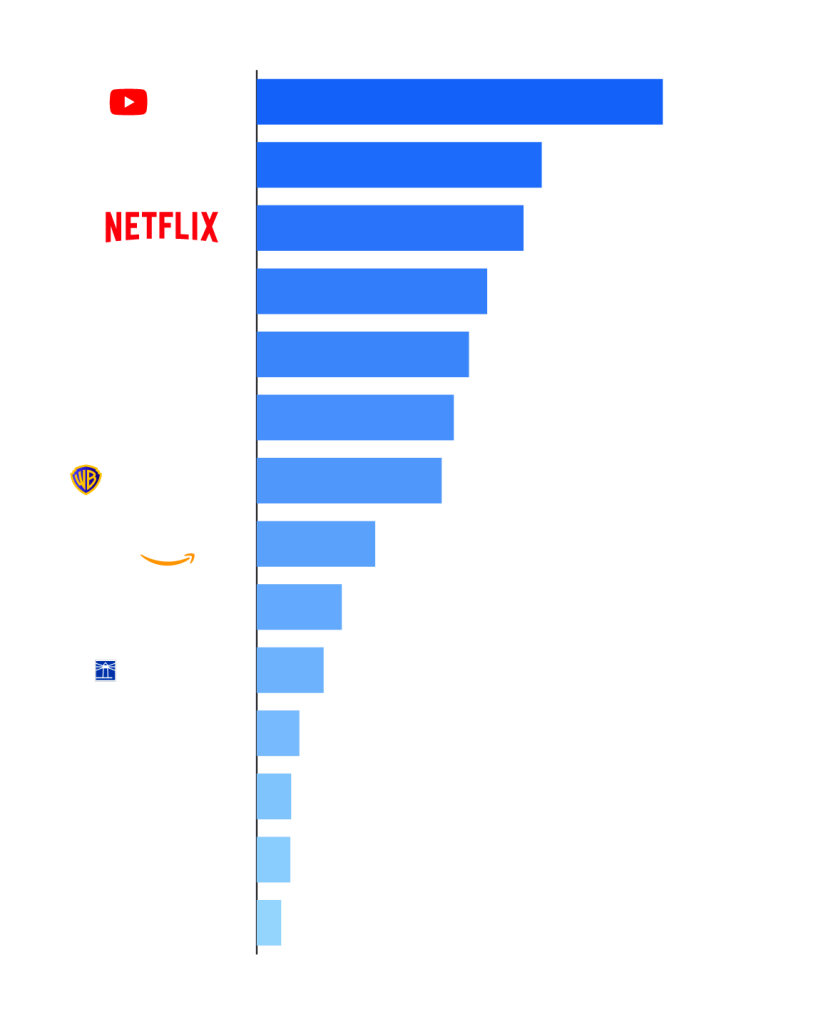
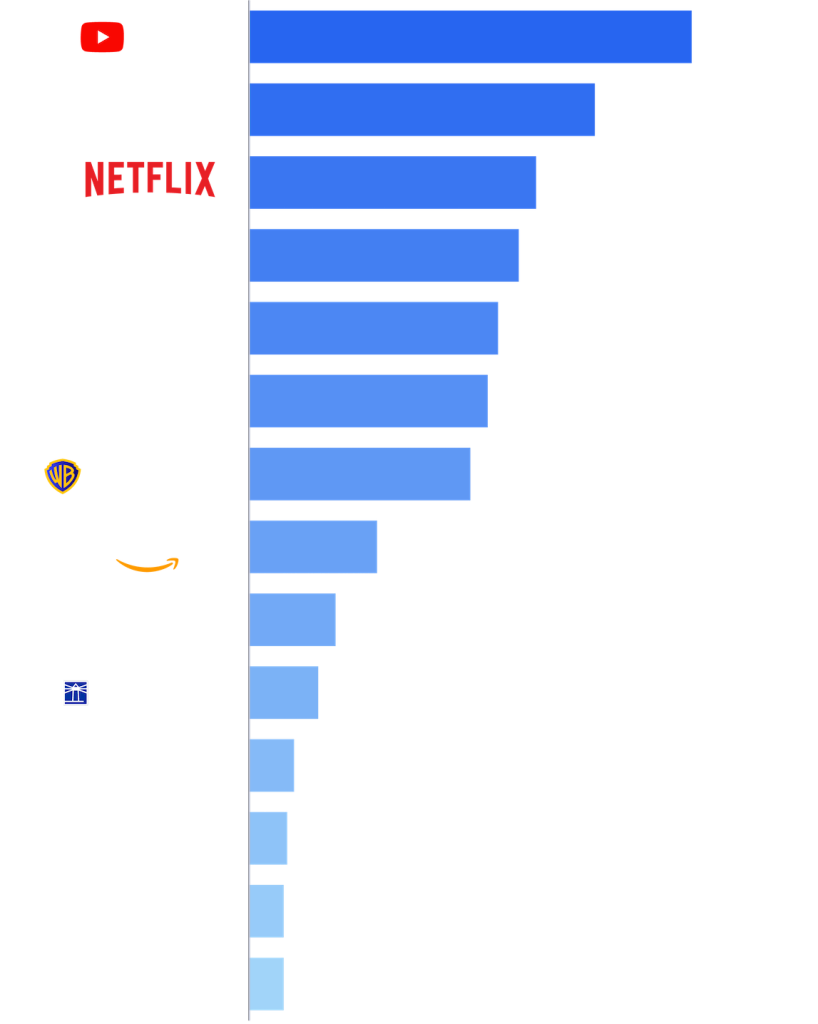
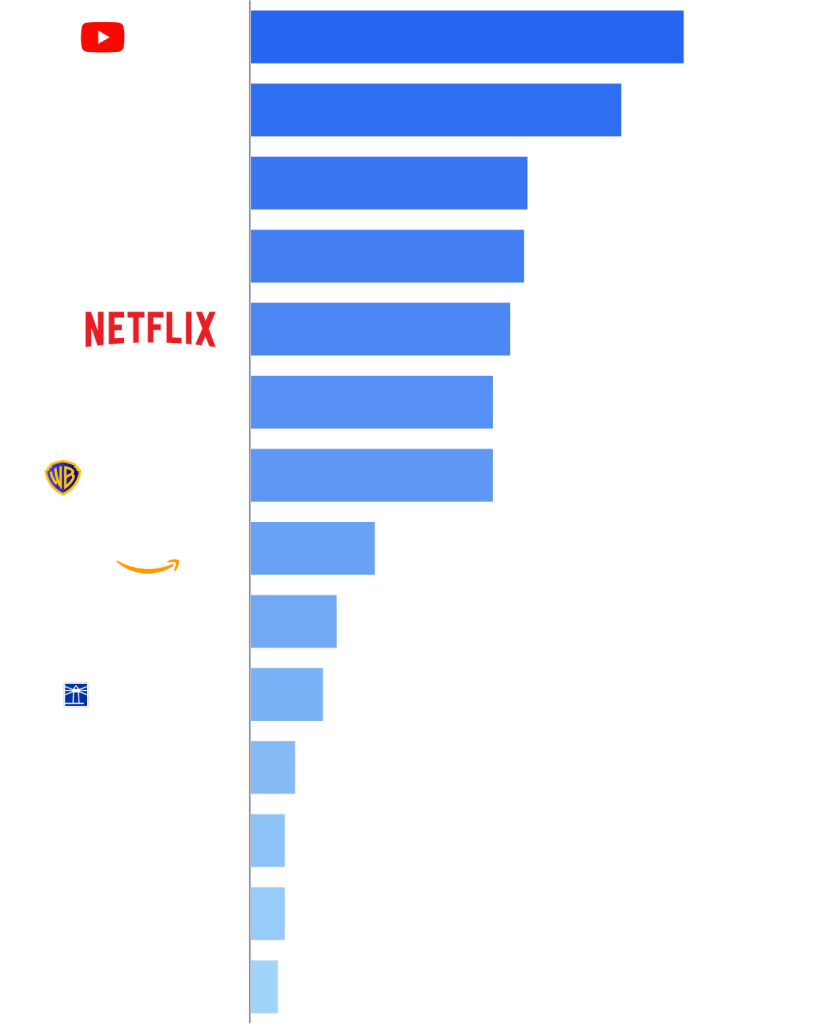
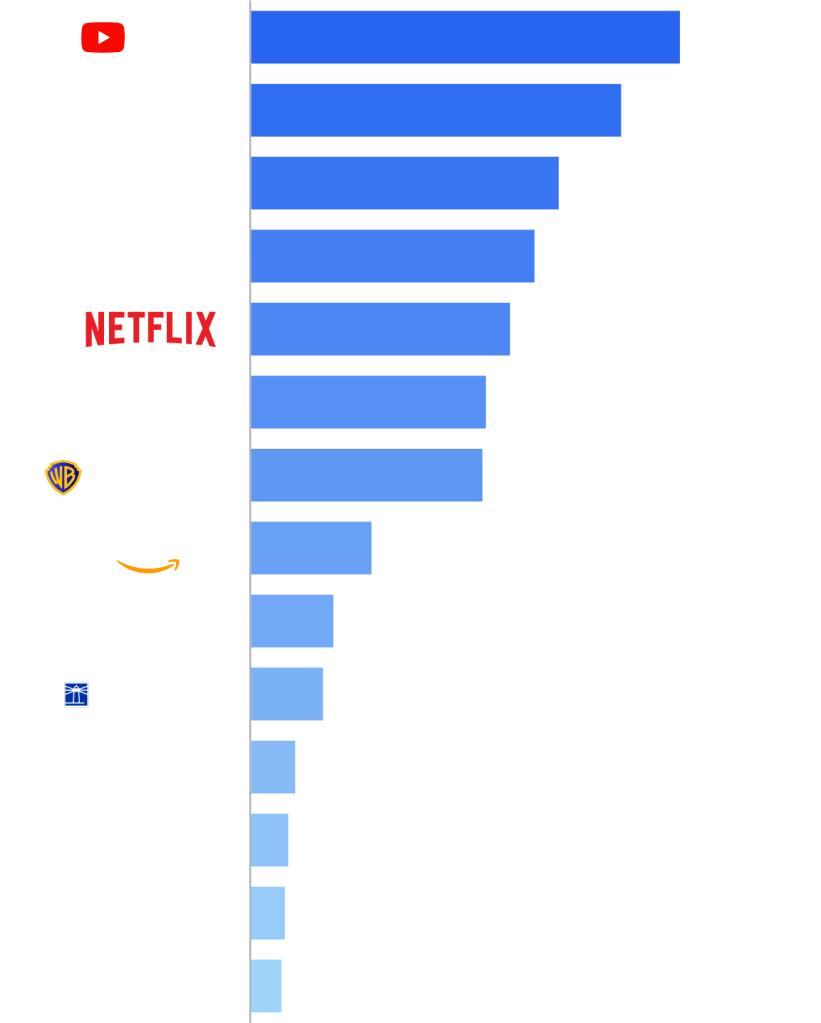
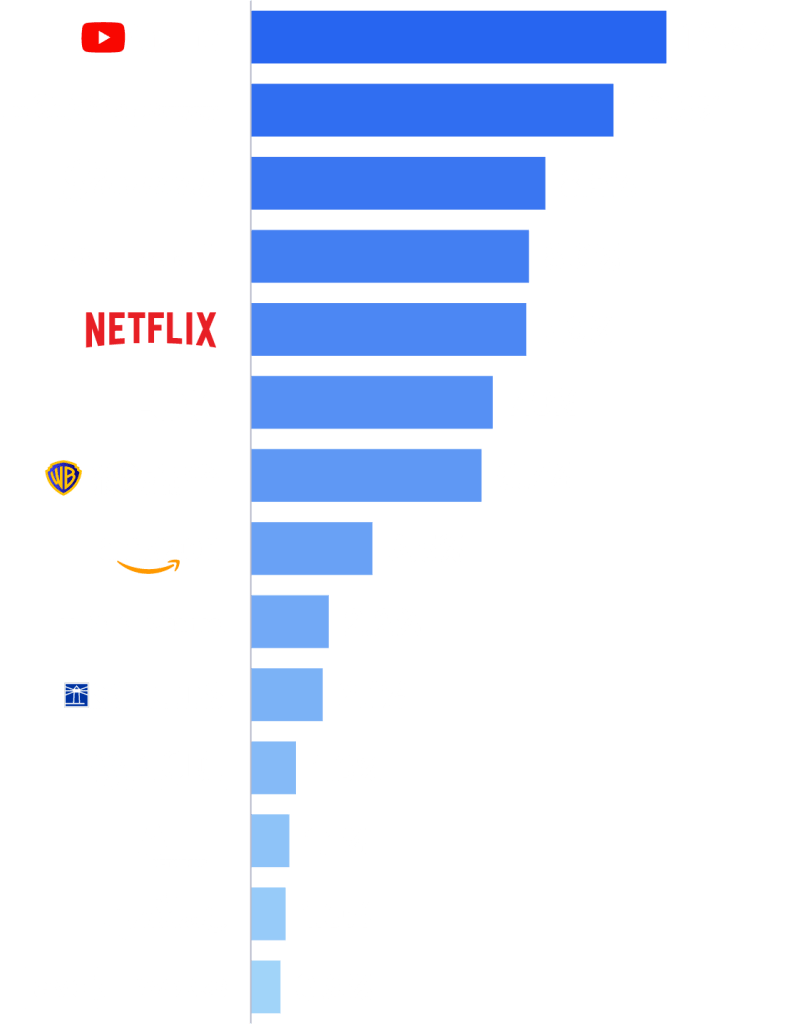
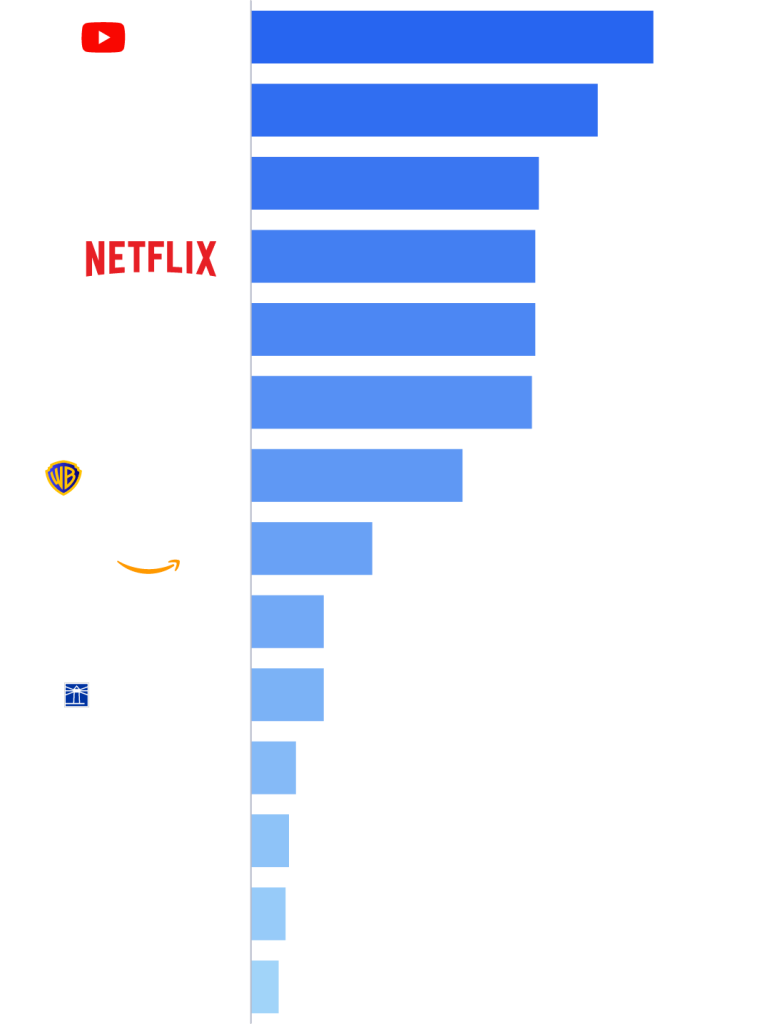
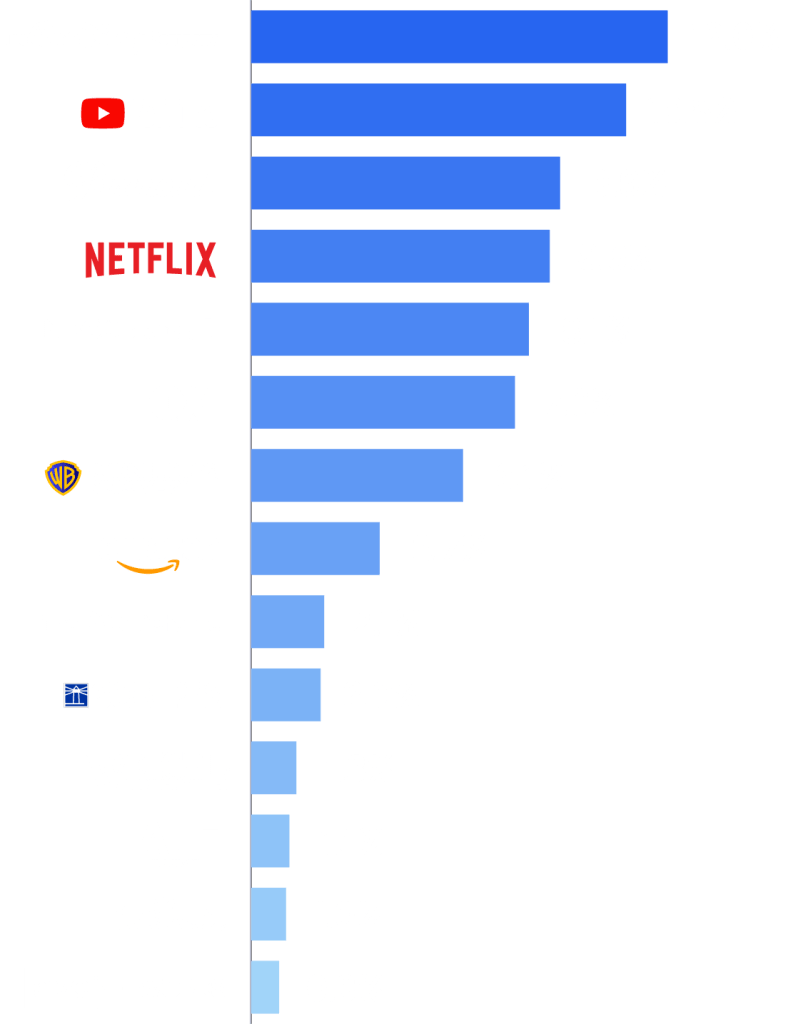
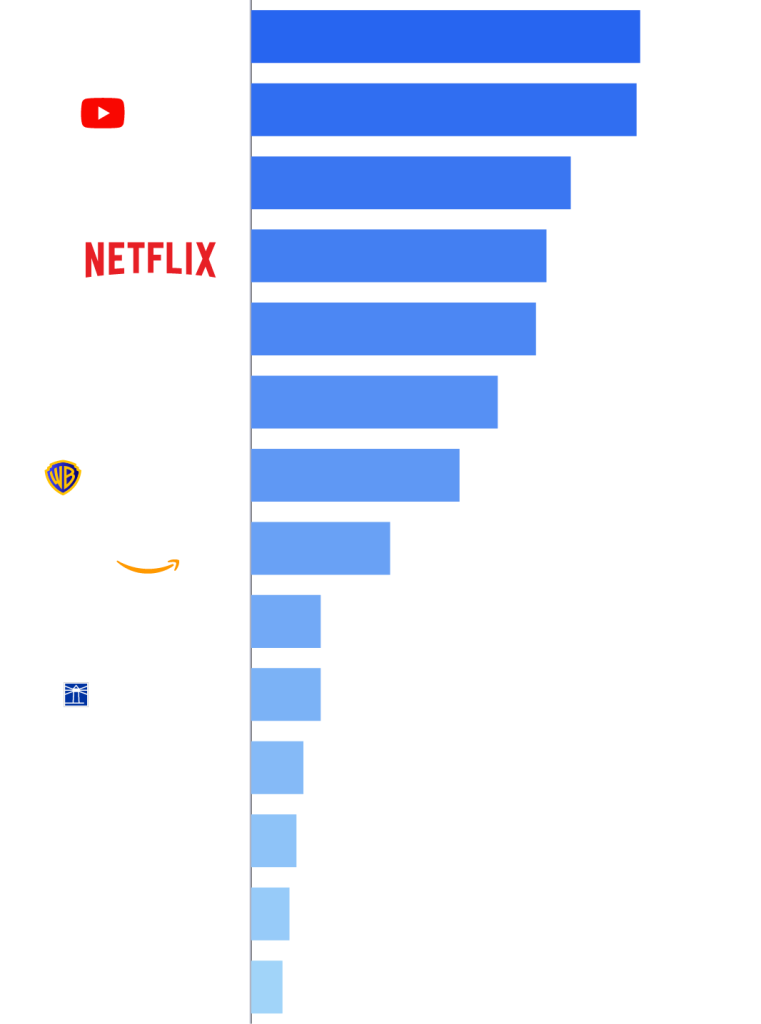
NEW YORK - December 22, 2025 – Nielsen’s November 2025 Media Distributor Gauge revealed a complex television landscape defined by live sports, strategic streaming releases and the Thanksgiving holiday. Paramount and Netflix each clocked double-digit growth over October, capitalizing on strong content slates and disrupting the Media Distributor rankings this month.
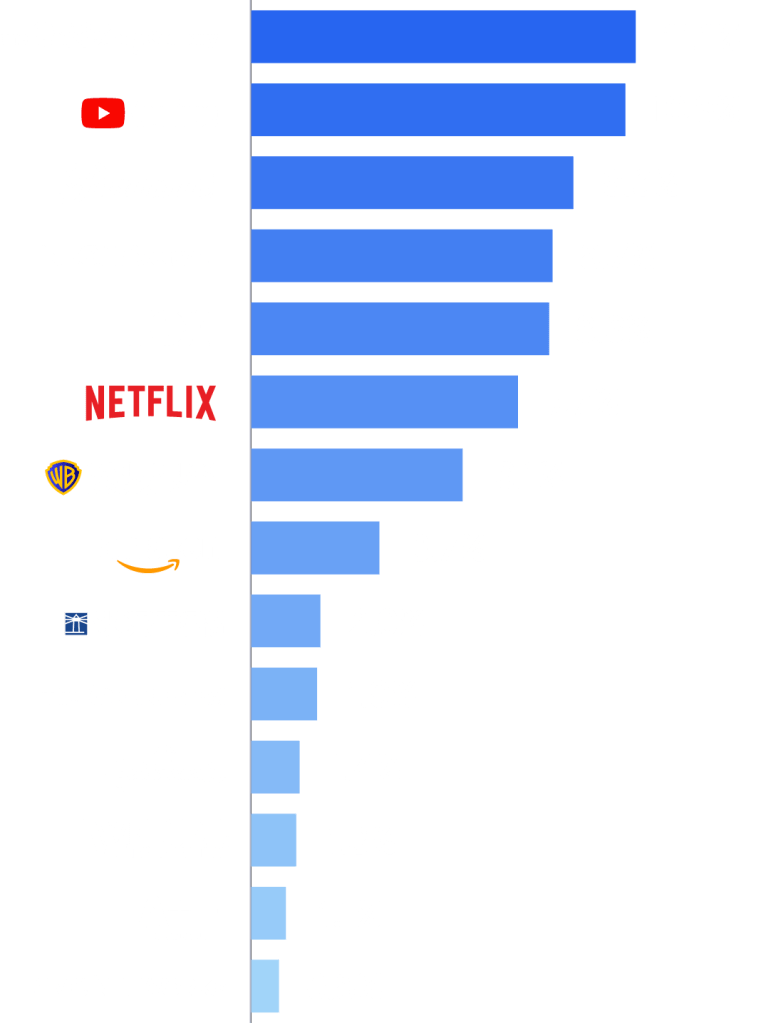
Paramount ha registrato un aumento del 14% degli ascolti complessivi a novembre e ha chiuso il mese con la quota televisiva più alta da aprile, conquistando l'8,9% del tempo totale di visione e salendo al terzo posto nella classifica Media Distributor Gauge. L'aumento di 0,7 punti di Paramount è stato il più consistente tra tutti i distributori ed è stato alimentato in egual misura dalle sue proprietà di trasmissione e streaming. Le affiliate della CBS e Paramount+ hanno registrato entrambe un aumento superiore al 18%, contribuendo rispettivamente con 0,5 e 0,2 punti percentuali alla quota totale di Paramount.
Netflix also delivered a robust performance in November, notching this month’s second-highest viewing gain (up 10%) to add 0.3 share points and achieve 8.3% of TV. While the return of Netflix’s iconic series Stranger Things provided the largest viewing impact with nearly 12 billion viewing minutes on its own, the streamer also benefited from its depth of content. Netflix’s new original series La bestia che è in me, and new Frankenstein film reimagined by Guillermo del Toro, combined for nearly 7 billion viewing minutes across the month.
Hallmark produced a 28% viewing gain in November and set the mark for the highest percentage viewing increase this month. Hallmark benefited from its signature slate of holiday movies and its original series, Mistletoe Murders, all of which led to 0.2 additional share points for 1.2% of total TV watch-time.
Nonostante i cambiamenti al di sotto di loro, YouTube e Disney hanno mantenuto le prime due posizioni in classifica con rispettivamente il 12,9% e il 10,5% della TV. La quota di YouTube nella TV è rimasta invariata rispetto al mese precedente. Disney ha perso 0,9 punti percentuali, in gran parte a causa del calo delle affiliate ABC e ESPN attribuibile all'interruzione della trasmissione dovuta alla controversia con YouTube TV.
NBCUniversal (NBCU) posted a strong month with a 7% increase in overall viewing, capturing its largest total since October 2024 with 8.8% of TV viewing (+0.2 pts.). NBCU’s gains were driven by a 22% surge in streaming on Peacock, largely fueled by NFL Sunday Night Football coverage, Thanksgiving Day programming, and its new original drama series Tutta colpa sua. Peacock achieved a non-Olympic monthly record 1.9% share of television in November, as reported in Nielsen’s The Gauge.
FOX ha attraversato un mese caratterizzato da oscillazioni sproporzionate tra le sue proprietà televisive e via cavo nel mese di novembre. Le affiliate televisive FOX hanno registrato un aumento del 22% rispetto a ottobre, trainate dalla partita di NFL del Giorno del Ringraziamento tra Green Bay e Detroit e dalle partite 4-7 delle World Series, dove la partita finale si è classificata al sesto posto tra le trasmissioni più viste del mese. Per quanto riguarda la televisione via cavo, l'audience di Fox News Channel è diminuita del 9% rispetto al mese scorso, mentre FS1 ha risentito dell'assenza dei playoff della MLB. Nel complesso, FOX ha chiuso il mese con un guadagno netto del 2,4%, ma a causa del maggiore aumento dell'utilizzo complessivo della televisione (+5,5%), ha ceduto 0,3 punti di share, chiudendo con l'8,1% della televisione a novembre.
L'intervallo di novembre 2025 ha coperto cinque settimane, dal 27/10/2025 al 30/11/2025. I rapporti Nielsen seguono il calendario delle trasmissioni, con intervalli settimanali che iniziano il lunedì.


Informazioni su Gauge
Il Gauge™ is Nielsen’s monthly snapshot of total broadcast, cable and streaming consumption that occurs through a television screen, providing the industry with a holistic look at what audiences are watching. The Gauge was expanded in April 2024 to include Il misuratore del distributore multimediale, which reflects total viewing by media distributor across these categories. Read more about The Gauge methodology and FAQs.
Informazioni su Nielsen
Nielsen is a global leader in audience measurement, data and analytics. Through our understanding of people and their behaviors across all channels and platforms, we empower our clients with independent and actionable intelligence so they can connect and engage with their global audiences—now and into the future. Learn more at www.nielsen.com and connect with us on social media (X, LinkedIn, YouTube, Facebook e Instagram).
Press Contact
Lauren Pabst
