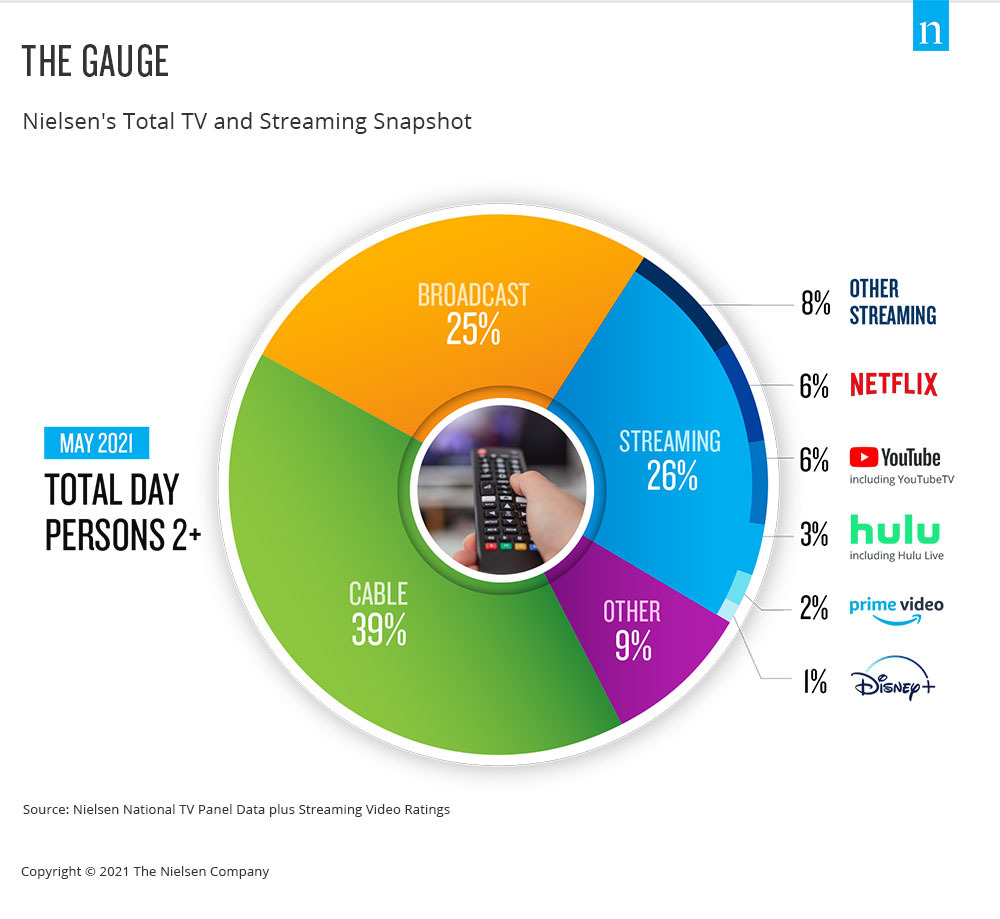
The pandemic was the catalyst for streaming services, which gained traction amongst a broader range of consumers. Over the last year, several traditional media companies dove into the streaming space, taking advantage of their vast video libraries and launching just in time to provide consumers in lockdown with more binge-worthy content. The recently launched The Gauge, Nielsen’s new monthly total TV and streaming snapshot, shows that streaming usage across all television homes has climbed to 26% of all time spent on TV. Streaming and broadcast now account for half of television time, with usage split evenly between the two channels.
“The past year has categorically shifted the television viewing landscape. Even as people begin to dive back into their pre-pandemic activities, based on the changes many made to enable streaming coupled with the variety of newly introduced services, we expect people to keep sampling and exploring their options. Maybe just as importantly, as production ramps back up, new content will enter the space, driving additional traction,” says Brian Fuhrer, SVP, Product Strategy at Nielsen.
Hear from Brian on how the television landscape is shifting, how this total streaming and TV snapshot might evolve over time with the emergence, launch and potential consumer adoption of additional streaming services and what this might mean for content creators and advertisers.
Learn more about why The Gauge is an important step towards Nielsen’s cross-platform measurement.
Metodologia
The Gauge è un intervallo mensile che mostra l'utilizzo totale della televisione (TUT) per Broadcast, Streaming, Cavo e Altro con un drill down sul canale Streaming.
- Tutte le altre TV includono: I componenti principali sono AOT (ALL Other Tuning), VOD, Streaming attraverso un set top box via cavo, gioco e utilizzo di altri dispositivi (riproduzione di DVD).
- Per altro streaming si intende qualsiasi streaming ad alta larghezza di banda (video) verso il televisore non elencato.
- Statistiche: Quota per categoria, Quota di TUT suddivisa per Distributori di Streaming
Lo streaming tramite set top box via cavo non è accreditato ai rispettivi distributori di streaming, ma è incluso nel gruppo "Tutti gli altri".
Data used is derived from two separately weighted panels and combined to create the infographic. Streaming data comes from a subset of TV households in the National TV panel that are enabled with the Streaming Meter, while linear sources as well as total usage are based on viewing from the overall TV panel.
Lo streaming lineare codificato si riflette sia nel gruppo lineare (broadcast, via cavo) sia sotto la rispettiva app di streaming lineare (ad es. Hulu Live, Youtube TV, altre app di streaming MVPD/vMVPD).