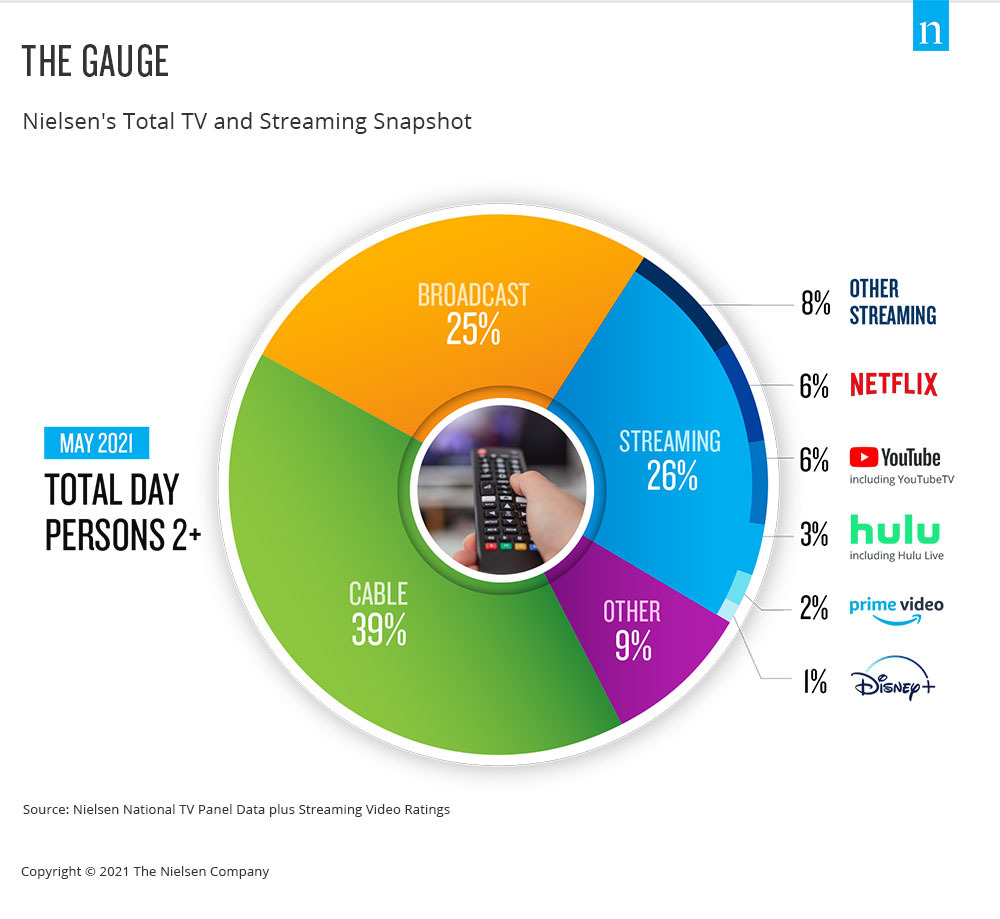
The pandemic was the catalyst for streaming services, which gained traction amongst a broader range of consumers. Over the last year, several traditional media companies dove into the streaming space, taking advantage of their vast video libraries and launching just in time to provide consumers in lockdown with more binge-worthy content. The recently launched The Gauge, Nielsen’s new monthly total TV and streaming snapshot, shows that streaming usage across all television homes has climbed to 26% of all time spent on TV. Streaming and broadcast now account for half of television time, with usage split evenly between the two channels.
“The past year has categorically shifted the television viewing landscape. Even as people begin to dive back into their pre-pandemic activities, based on the changes many made to enable streaming coupled with the variety of newly introduced services, we expect people to keep sampling and exploring their options. Maybe just as importantly, as production ramps back up, new content will enter the space, driving additional traction,” says Brian Fuhrer, SVP, Product Strategy at Nielsen.
Hear from Brian on how the television landscape is shifting, how this total streaming and TV snapshot might evolve over time with the emergence, launch and potential consumer adoption of additional streaming services and what this might mean for content creators and advertisers.
Learn more about why The Gauge is an important step towards Nielsen’s cross-platform measurement.
방법론
The Gauge 방송, 스트리밍, 케이블 및 기타에 대한 총 텔레비전 사용량(TUT)을 스트리밍 채널 드릴다운과 함께 월 단위로 표시합니다.
- 기타 모든 TV 포함: 여기에는 AOT(기타 모든 튜닝), VOD, 케이블 셋톱박스를 통한 스트리밍, 게임 및 기타 장치(DVD 재생) 사용이 포함됩니다.
- 기타 스트리밍은 목록에 없는 모든 고대역폭(비디오) 스트리밍을 말합니다.
- 통계: 카테고리별 점유율, 스트리밍 유통업체에 대한 TUT 점유율 세분화
케이블 셋톱박스를 통한 스트리밍은 각 스트리밍 배포자에게 크레딧이 제공되지 않고 '기타 모든' 그룹에 포함됩니다.
Data used is derived from two separately weighted panels and combined to create the infographic. Streaming data comes from a subset of TV households in the National TV panel that are enabled with the Streaming Meter, while linear sources as well as total usage are based on viewing from the overall TV panel.
인코딩된 선형 스트리밍은 선형(방송, 케이블) 그룹과 각 선형 스트리밍 앱(예: Hulu Live, Youtube TV, 기타 스트리밍 MVPD/vMVPD 앱) 아래에 모두 반영됩니다.