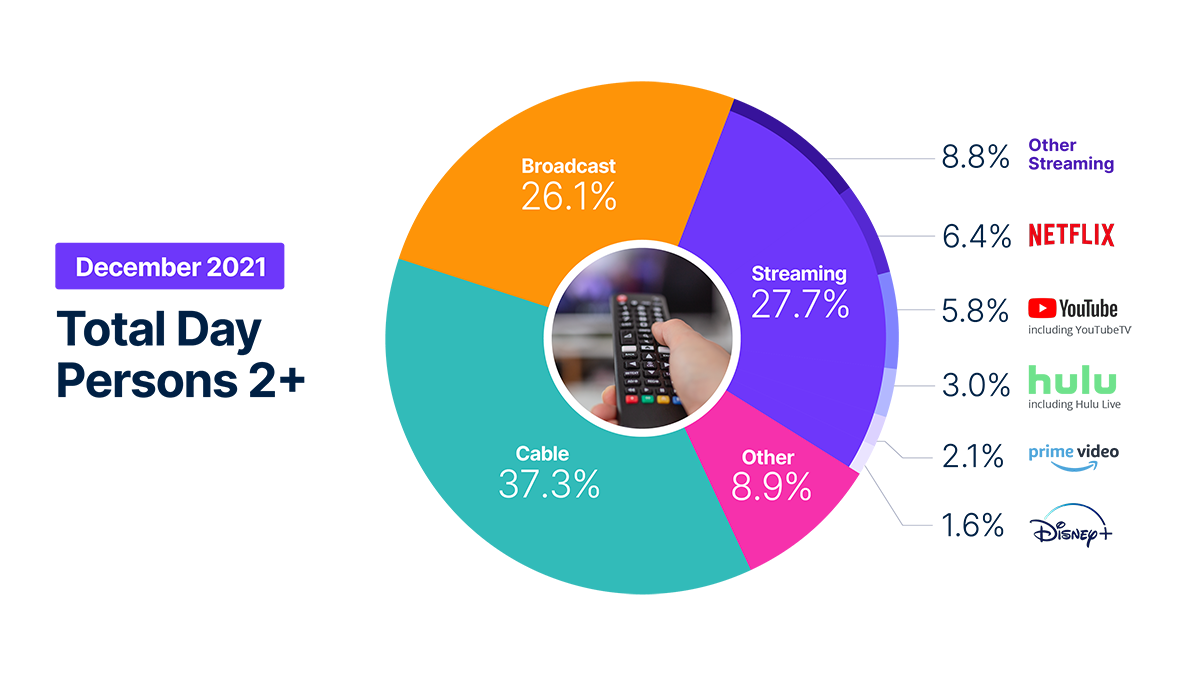
From a total viewing perspective, streaming was the clear outlier during the week of Christmas, as Americans watched a total of 183 billion minutes – an all-time high – across the growing range of over-the-top platforms. The aggregate viewing was enough to easily dethrone the 160 billion minutes watched during March 2020 (when stay-at-home restrictions began in the U.S.), as well as the 178 billion minutes watched during the week of Thanksgiving just a month earlier. The spike in streaming viewing also gave streamers 33% viewing share of total TV viewing during the week of Christmas, which was the most as measured by Nielsen.
From a reporting standpoint, this month’s edition of The Gauge expands the granularity of the data we provide. Instead of rounding, we have expanded viewing share calculations to display an additional decimal of data. This additional data will make it easier to see month-to-month changes in viewing share. In December, broadcast viewing dropped one share point and the “other” category, which includes video on-demand content, cable set top box streaming, gaming, and DVD usage, gained 1.6% share on the strength of video gaming, during what could be considered the “premiere season” in that category. Overall streaming was fairly flat for the month, remaining consistent with 28% share.


Tonton video ini untuk mendengar Brian Fuhrer, SVP, Strategi Produk di Nielsen memberikan pandangan di balik layar tentang beberapa perubahan tampilan yang mendasari The Gauge.
METHODOLOGY AND FREQUENTLY ASKED QUESTIONS
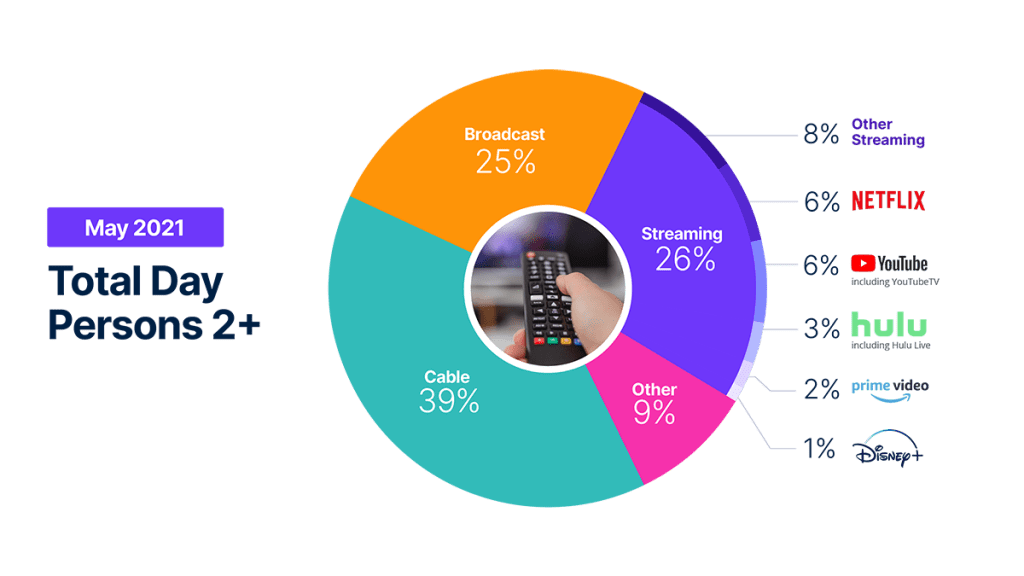
The Gauge menyediakan analisis makro bulanan tentang bagaimana konsumen mengakses konten di seluruh platform pengiriman televisi utama, termasuk Siaran, Streaming, Kabel, dan sumber-sumber lainnya. Hal ini juga mencakup rincian distributor streaming individual utama. Grafik itu sendiri menunjukkan pangsa berdasarkan kategori dan total penggunaan televisi oleh masing-masing distributor streaming.
Data untuk The Gauge berasal dari dua panel yang ditimbang secara terpisah dan digabungkan untuk membuat grafik. Data streaming Nielsen berasal dari sebagian rumah tangga TV yang diaktifkan Pengukur Streaming dalam panel TV Nasional. Sumber TV linear (Siaran dan Kabel), serta penggunaan total didasarkan pada penayangan dari panel TV Nielsen secara keseluruhan.
All the data is based on a specific time period for each viewing source. The data, representing a 5 week month, includes a combination of Live+7 for weeks 1 – 4 in the data time period. (Note: Live+7 includes live television viewing plus viewing up to seven days later. Live +3 includes television viewing plus viewing up to three days later.)
Di dalam The Gauge, "Lainnya" mencakup semua TV lainnya. Hal ini terutama mencakup semua penyetelan lainnya (sumber yang tidak terukur), video on demand (VOD) yang tidak terukur, streaming melalui dekoder kabel, game, dan penggunaan perangkat lain (pemutaran DVD). Karena streaming melalui dekoder kabel tidak mengkreditkan masing-masing distributor streaming, maka hal ini dimasukkan ke dalam kategori "Lainnya". Memberikan kredit kepada distributor streaming individual dari dekoder kabel adalah sesuatu yang terus diupayakan Nielsen seiring dengan penyempurnaan teknologi Pengukur Streaming.
Platform streaming yang terdaftar sebagai "Streaming Lainnya" mencakup streaming video dengan bandwidth tinggi di televisi yang tidak dipecah satu per satu.
Ya, Hulu termasuk menonton di Hulu Live dan Youtube termasuk menonton di Youtube TV.
Encoded Live TV, aka encoded linear streaming, is included in both the Broadcast and Cable groups (linear TV) as well as under Streaming and other streaming e.g. Hulu Live, Youtube TV, Other Streaming MVPD/vMVPD apps. (Note: MVPD, or multichannel video programming distributor, is a service that provides multiple television channels. vMVPDs are distributors that aggregate linear (TV) content licensed from major programming networks and packaged together in a standalone subscription format and accessible on devices with a broadband connection.)