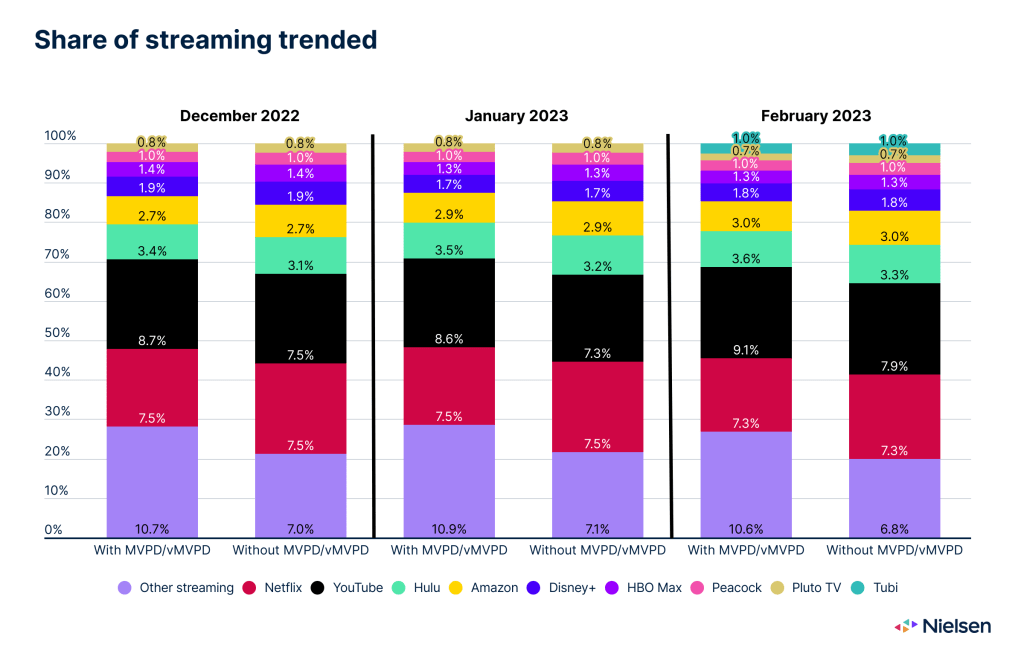
Tubi TV, for the first time, grabs 1% of total streaming viewership
Note de l'éditeur : Les pourcentages de cette édition de la The Gauge reflètent un changement dans la manière dont le visionnement de contenu provenant de distributeurs virtuels de programmes vidéo multicanaux (vMVPD) et d'applications de distributeurs de programmes vidéo multicanaux (MVPD) est pris en compte. Veuillez vous référer à la méthodologie et à la section FAQ ci-dessous pour plus de détails.
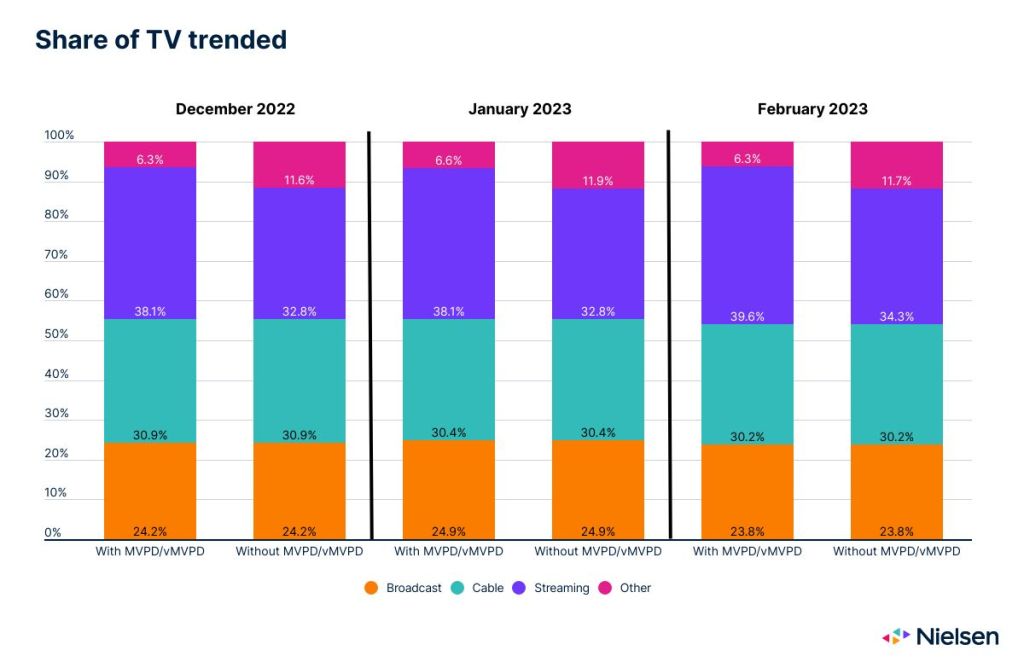
Much can be said about the seasonality of TV usage, and viewing trends in February were very much in line with historical norms, as total usage of TV dropped 5.1% from the previous month. While in line with seasonal norms, TV engagement in February confirms a very basic truth: viewership reflects the availability of what audiences are looking for.
Across categories, February had fewer high-demand, mass-appealing programs than January, which led to declines in viewership across broadcast, cable and streaming. January is always a banner month for TV viewing, highlighted by the culmination of the NFL season, which sets the bar very high.
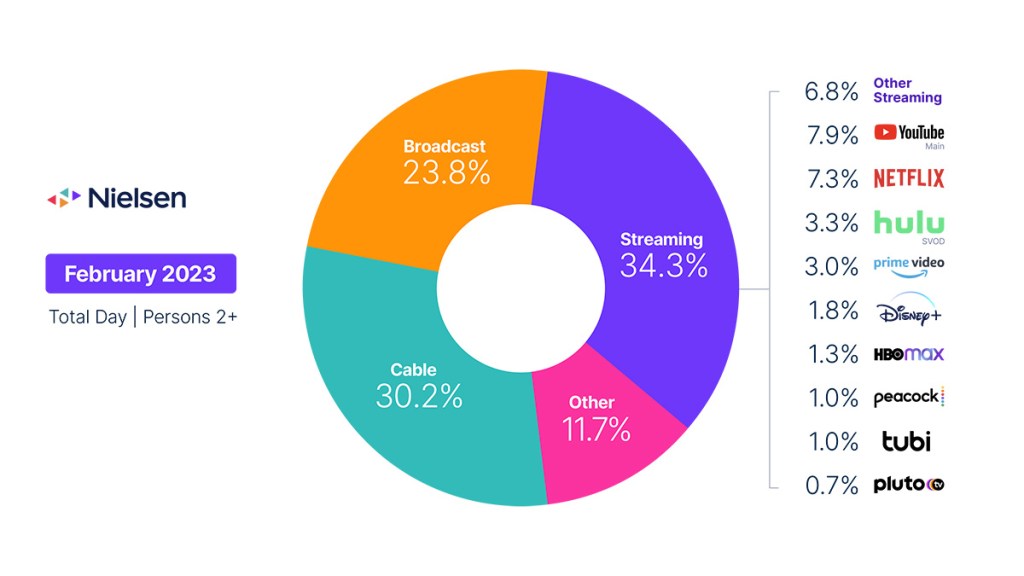
Audiences did not, however, have a shortage of content options in February, especially across streaming platforms, which welcomed a wide array of original and acquired content, complemented by a host of movie additions, including Black Panther: Wakanda Forever on Disney+. As a result, streaming platforms remained the favored destination for TV audiences, but overall viewing to streaming content was down 0.9% from January—the smallest decline across categories. Despite the drop in total streaming viewing, the category gained 1.5 share points to account for 34.3% of TV usage.
Within the streaming category, Tubi TV became the latest service to achieve a 1% share of TV usage, joining Pluto TV as the second free, ad-supported platform to be broken out from the “other streaming” category. Other streaming highlights in February included:
- New Amsterdam was the most-viewed streaming program, with 4.6 billion viewing minutes across Netflix and Peacock.
- The Last of Us was the second most-viewed program, with 4.4 billion viewing minutes on HBO Max.
- Le nombre de vues sur YouTube (principal) a augmenté de 2
- The arrival of a new season of You on Netflix generated 4.2 billion viewing minutes, but overall usage on the platform was down 6.7%.
Usage across broadcast and cable was down 9.2% and 5.7%, respectively. Sports viewing on broadcast was down 64.7%, with only the Winter Olympics and news provide a boost to TV viewing during a traditionally slower TV month to rely on after the NFL playoffs concluded in January, and the 3.6% rise in drama viewing and the 6.8% rise in sitcom viewing weren’t enough to cover the loss. As was the case on broadcast, a 2.4% rise in cable news viewing (driven by the State of the Union address) wasn’t enough to cover the 34.6% drop in sports viewing, resulting in a 5.7% drop in total cable viewing.
Tendances des données en février avec Brian Fuhrer
Explication du changement de méthodologie
Méthodologie et questions fréquemment posées
The Gauge provides a monthly macroanalysis of audience viewing behaviors across key television delivery platforms, including broadcast, streaming, cable and other sources. It also includes a breakdown of the major, individual streaming distributors. The chart itself represents monthly total television usage, broken out into share of viewing by category and by individual streaming distributors.
Comment la "The Gauge" est-elle créée ?
The data for The Gauge is derived from two separately weighted panels and combined to create the graphic. Nielsen’s streaming data is derived from a subset of Streaming Meter-enabled TV households within the National TV panel. The linear TV sources (broadcast and cable), as well as total usage are based on viewing from Nielsen’s overall TV panel.
All the data is time period based for each viewing source. The data, representing a broadcast month, is based on Live+7 viewing for the reporting interval (Note: Live+7 includes live television viewing plus viewing up to seven days later for linear content).
What is included in “Other”?
Within The Gauge, “other” includes all other TV usage that does not fall into the Broadcast, Cable or Streaming categories. This primarily includes all other tuning (unmeasured sources), unmeasured video on demand (VOD), streaming through a cable set top box, audio streaming, gaming and other device (DVD playback) use. Because streaming via cable set top boxes does not credit respective streaming distributors, these are included in the “other” category. Crediting individual streaming distributors from cable set top boxes is something Nielsen continues to pursue as we enhance our Streaming Meter technology.
Qu'est-ce qui est inclus dans les "autres flux" ?
Les plateformes de streaming répertoriées comme "autre streaming" comprennent tout streaming vidéo à large bande passante sur la télévision qui n'est pas ventilé individuellement. Les applications conçues pour diffuser des émissions en direct et des programmes (linéaires) du câble (applications VMVPD ou MVPD comme Sling TV ou Charter/Spectrum) sont exclues de la catégorie "autre streaming".
Quelle est la contribution du streaming linéaire ?
Linear streaming (as defined by the aggregation of viewing to vMVPD/MVPD apps) is excluded from the streaming category as the broadcast and cable content viewed through these apps credits to its respective category. This methodological change was implemented with the February 2023 interval.
Qu'en est-il de la diffusion en direct sur Hulu et YouTube ?
Linear streaming via vMVPD apps (e.g., Hulu Live, YouTube TV) are excluded from the streaming category. ‘Hulu SVOD’ and ‘YouTube Main’ within the streaming category refer to the platforms’ usage without the inclusion of linear streaming.


