La nécessité d'une mesure cohérente dans un paysage où le numérique occupe une place prépondérante
Few changes in the media industry are as defining as audiences’ relationship with television. And the latest evolution capturing audiences’ attention is streaming services, smart TVs, and the content they support. In the U.S. alone, Americans watched 19 million years worth of streaming content in 2022.
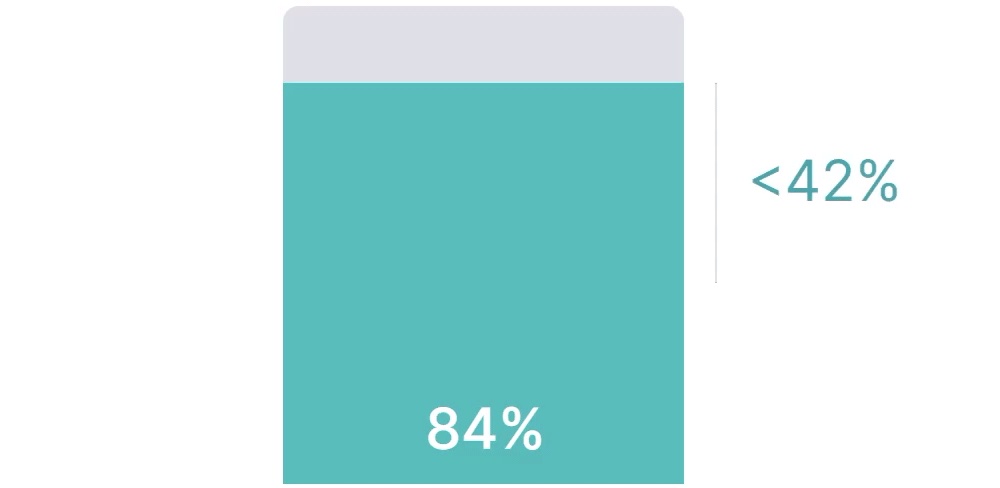
So, naturally, brands have adjusted their media strategies: 84% of global marketers say they include streaming channels in their media plans.
Le problème ? Moins de la moitié d'entre eux estiment que ces dépenses sont efficaces.
In December of 2022, we surveyed 1,524 global marketing professionals to understand how they feel about changing viewing behaviors, the rise of streaming and CTV, and solutions for tracking and proving campaign impact.
Voici quatre informations clés tirées de l'enquête :
1
Recession or not, marketers expect ad budgets to grow
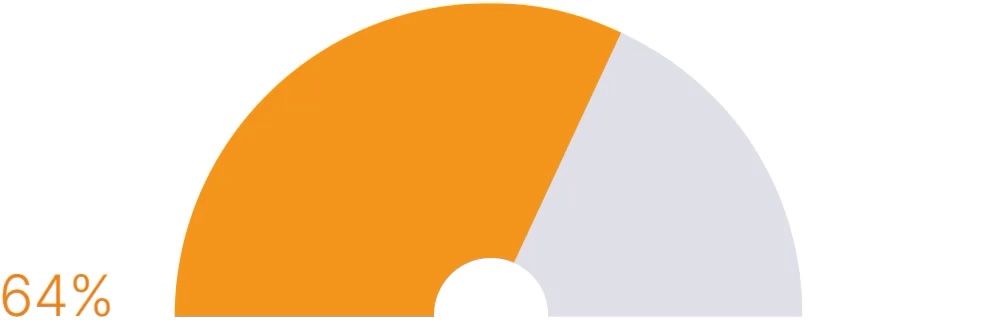
Despite 69% of global marketers saying economic conditions had a big impact on planning, 64% expect their budgets to grow.
2
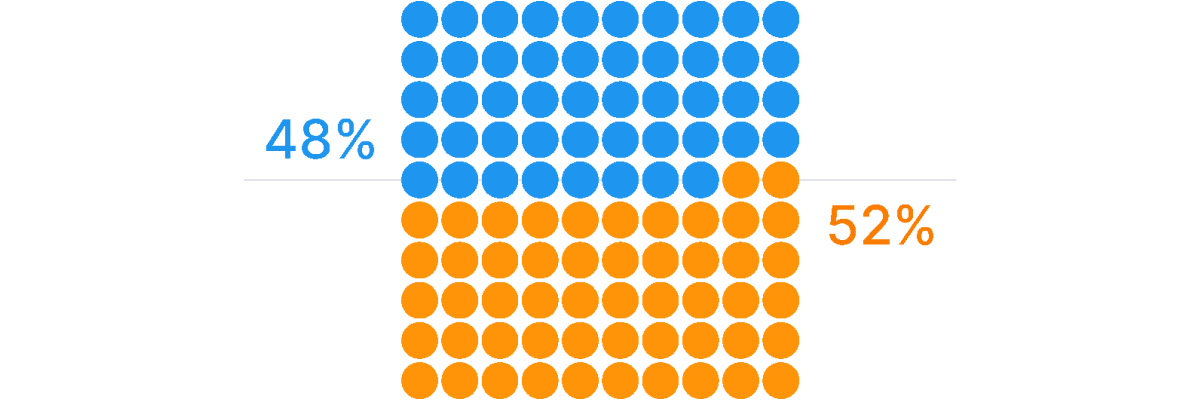
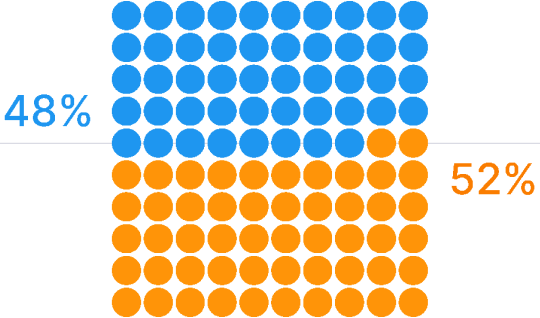
Streaming is the future, but value remains unclear
84% of global marketers include streaming in their media planning. Less than half, however, view this spending as effective.
3
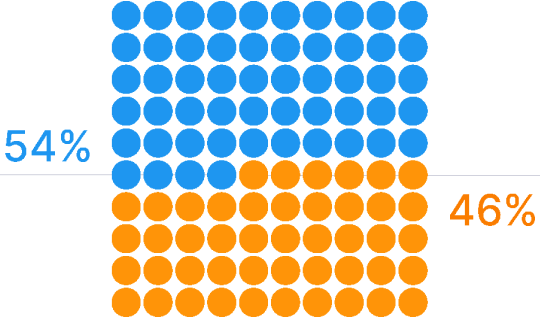
La confiance dans le retour sur investissement est la plus faible sur les canaux numériques
Seuls 54 % des spécialistes du marketing ont confiance dans la mesure du retour sur investissement des canaux numériques.

4
La multiplicité des outils de mesure pourrait nuire à la confiance
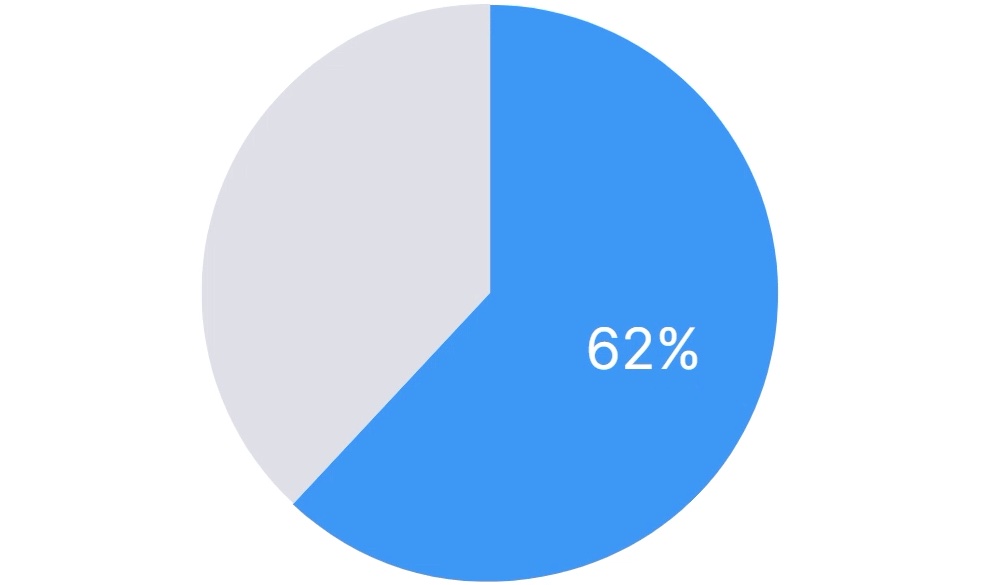
62% of marketers use multiple measurement solutions to achieve a comprehensive look at marketing performance, which may be contributing to the lack of confidence.
Succès !
Continuez à défiler pour accéder au rapport marketing annuel 2023 de Nielsen.
Vous souhaitez conserver ces informations ?
Aperçu n° 1
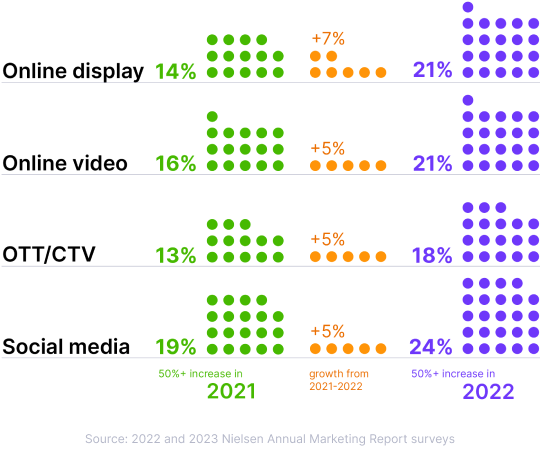
Les dépenses numériques dépassent les investissements dans les autres canaux
For marketers, 2023 was assumed to be an uncertain year, with 69% surveyed for this report saying that the economic conditions had an impact on their planning.
Still, 64% expect their ad budgets to increase this year, with 13% even expecting increases of 50% or more. Much of that growth can be attributed to CTV and streaming.
Changements budgétaires prévus de 50 % ou plus tout au long de l'année
Anticipated CTV/OTT spending aligns with global trends we’ve been tracking.
In the U.S., 2022 digital video ad spend was up 171% à partir de 2020.
Across Puerto Rico, Mexico and Brazil, digital ad spend increased 228%* between 2021 and 2022 for a total of US$24.5 billion, with 58% (US$14.2 billion) allocated to digital video.
In France, Denmark and the U.K., internet-based video spend increased from US$2.3 billion in the first three quarters of 2020 to 4 en 2022.
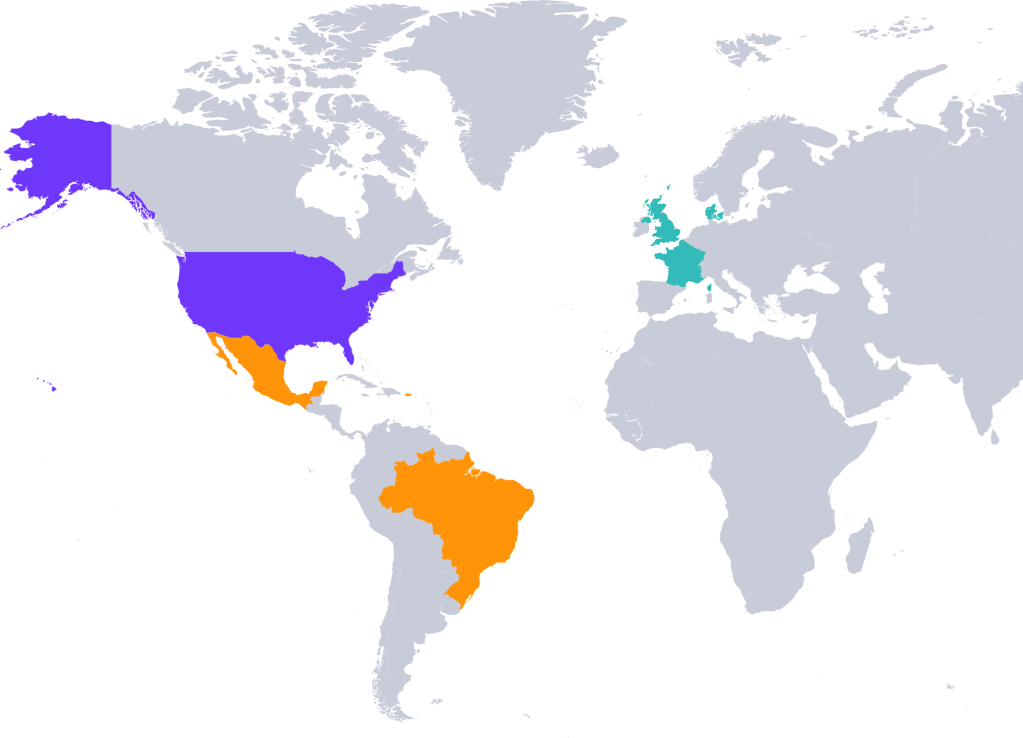
*The data reported is derived from the increased coverage of our Ad Intel measurement, which shows greater visibility of actual spending on digital vehicles. (1) Digital activity reporting in Brazil starts in January 2022. (2) PPP and social activity reporting in Puerto Rico starts in May 2022.

Aperçu n° 2
Les budgets publicitaires mondiaux s'appuient sur CTV
L'augmentation des dépenses consacrées à la vidéo en ligne reflète l'évolution du public vers le streaming en particulier.

In the U.S., Americans watched more than 19 millions d'années de contenu en continu en 2022.

In Mexico, streaming grew to account for 15 à partir de décembre 2022.

In Thailand, streaming content reaches more than 50% de l'audience TV.

In Australia, 70% des personnes 14 ans et plus déclarent utiliser l'internet pour regarder des vidéos en streaming.
1 Nielsen Streaming Content Ratings and Nielsen National TV panel
2 The Gauge Mexico
3 Thailand Cross-Platform Ratings
4 Australia Consumer and Media View, Q4 2022

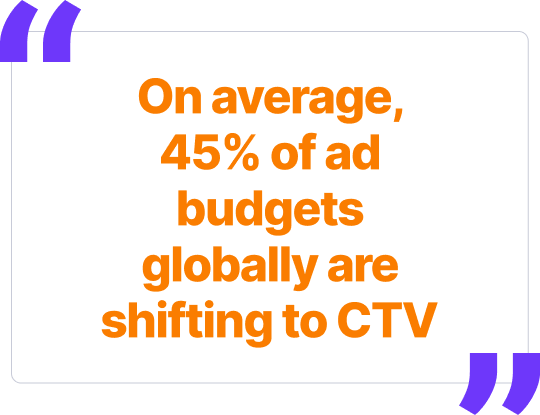
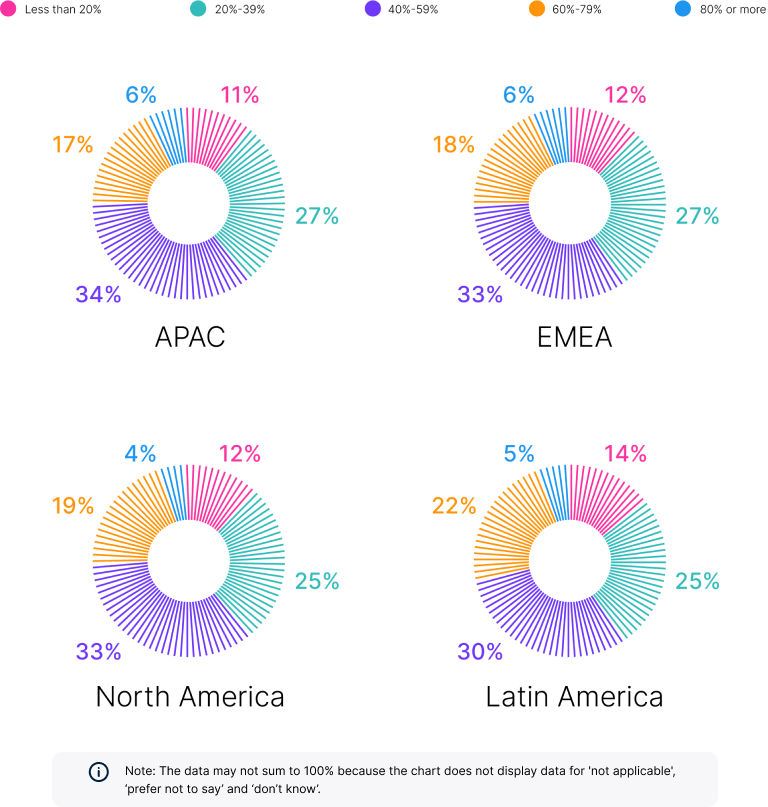
Naturally, global marketers are refining their media spend: On average, 32% report allocating 40%-59% of their budgets to CTV, and nearly one-fifth (19%) report shifting 60%-79%.
Les budgets publicitaires mondiaux se déplacent vers CTV
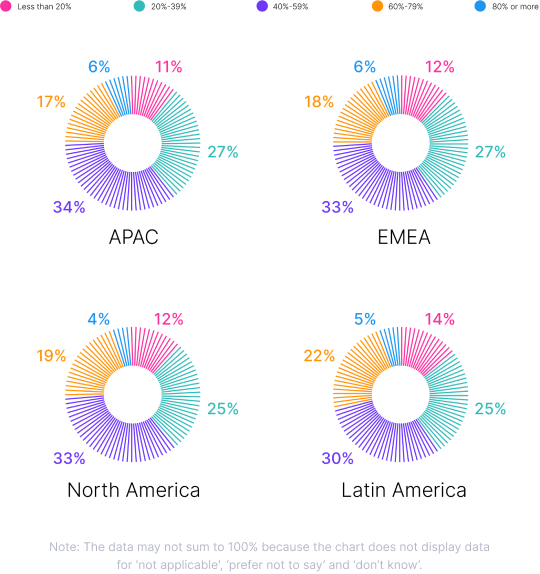
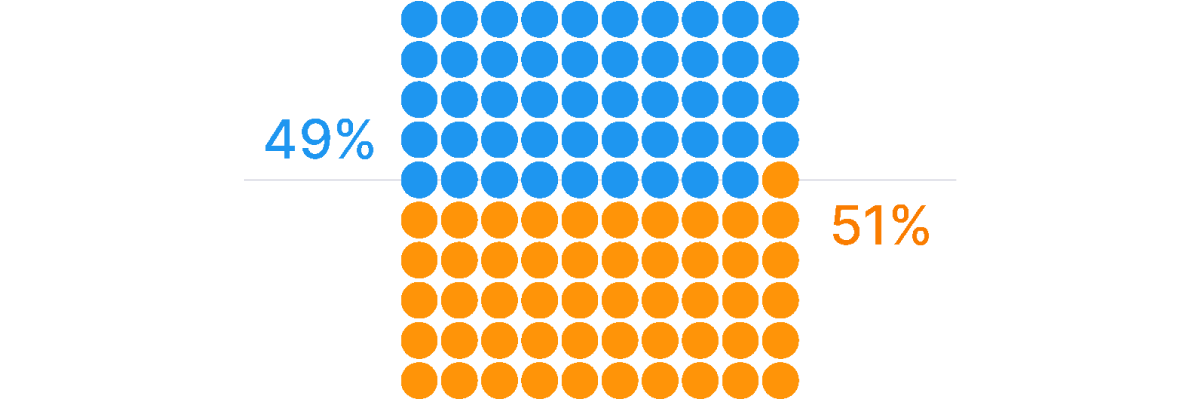
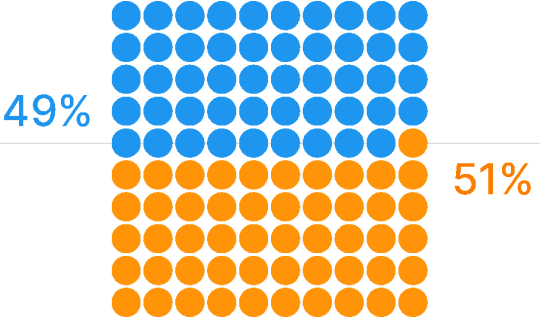
Zenith Media forecasts that global online video ad spending will grow at a compound annual growth rate (CAGR) of 4.8% through 2025 to account for 30% of the overall ad market. The company expects advertising on subscription video on demand (SVOD) services to grow at a CAGR of 27.9% to reach US$13.1 billion by 2025.
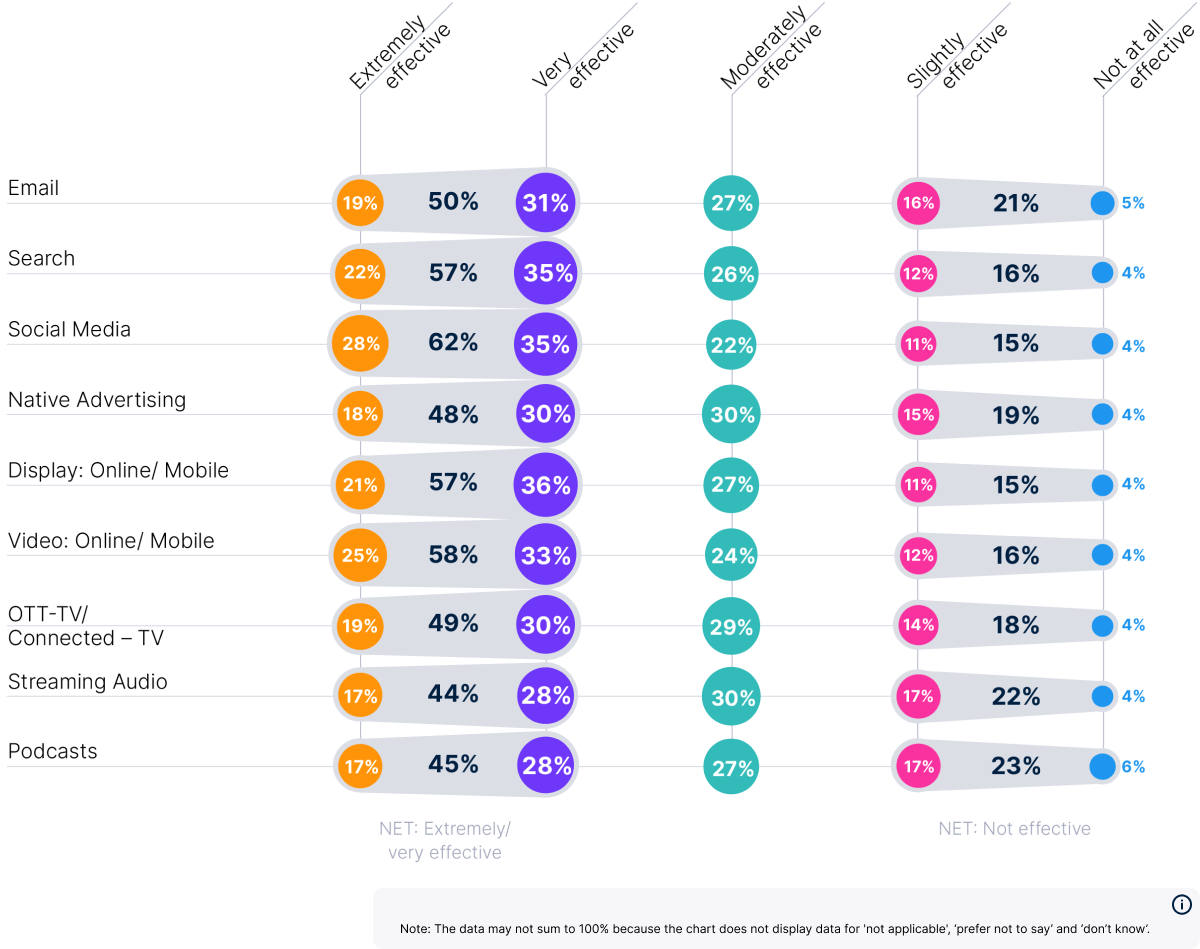
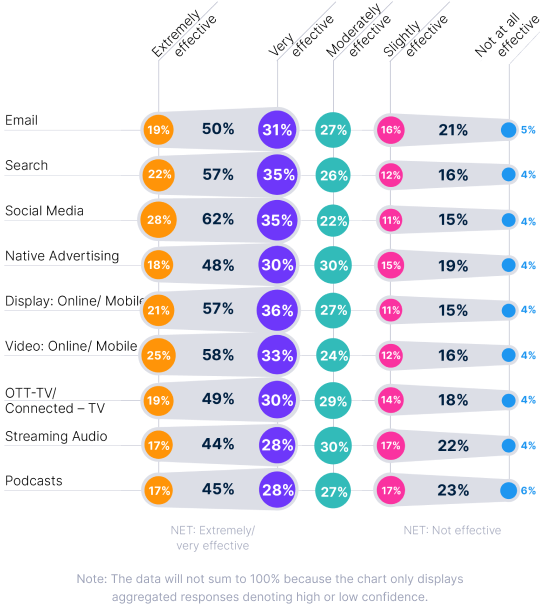
This is massive momentum. And yet, according to global marketers, the perceived effectiveness of their CTV/streaming investments is just 49%.
Efficacité perçue des dépenses numériques par canal

Aperçu n° 3
La confiance est faible en ce qui concerne la mesure holistique du retour sur investissement
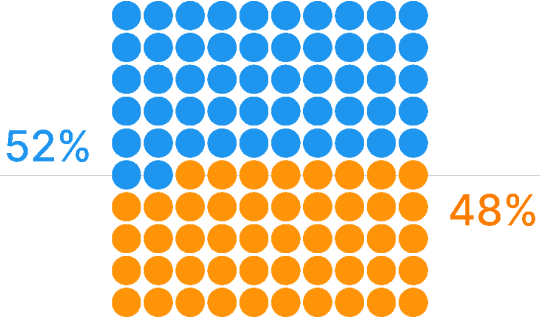
Measurable returns will always help marketers make tactical investment decisions, but cross-media ROI measurement challenges have more than half of global marketers (52% on average) focused only on reach and frequency metrics.
L'approche des spécialistes du marketing en matière de mesure cross-média


One potential cause for the simplified focus is under-utilized marketing technology (martech). Gartner’s 2022 Marketing Technology Survey Insights found that marketers aren’t using their tools as well as they could be: Only 42% of survey respondents said they use the full breadth of their martech capabilities, down from 58% in 2020.
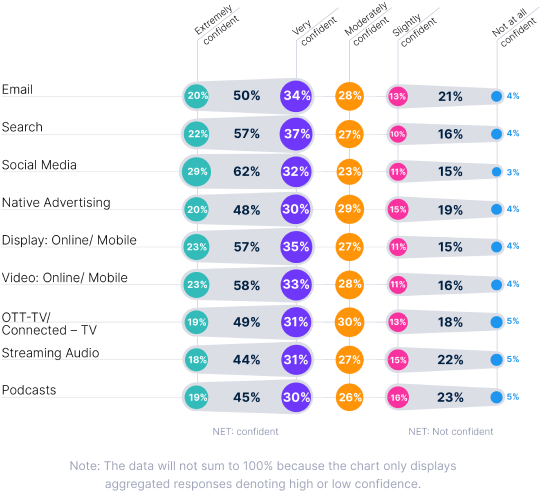
Untapped martech could also explain the gap between marketers’ stated belief in their martech’s ability to measure aggregate ROI (69%) and their reported ROI confidence at the individual channel level, which is much lower.
Confiance dans la mesure du retour sur investissement par canal


Vue d'ensemble n° 4
Les outils spécifiques à un canal ne donnent pas une image complète des performances
Shaky ROI confidence isn’t all untapped martech’s fault. Several other factors are at play in a crowded media landscape, including:
Nombreux sont ceux qui n'assimilent pas le succès d'une campagne à l'atteinte d'une cible.
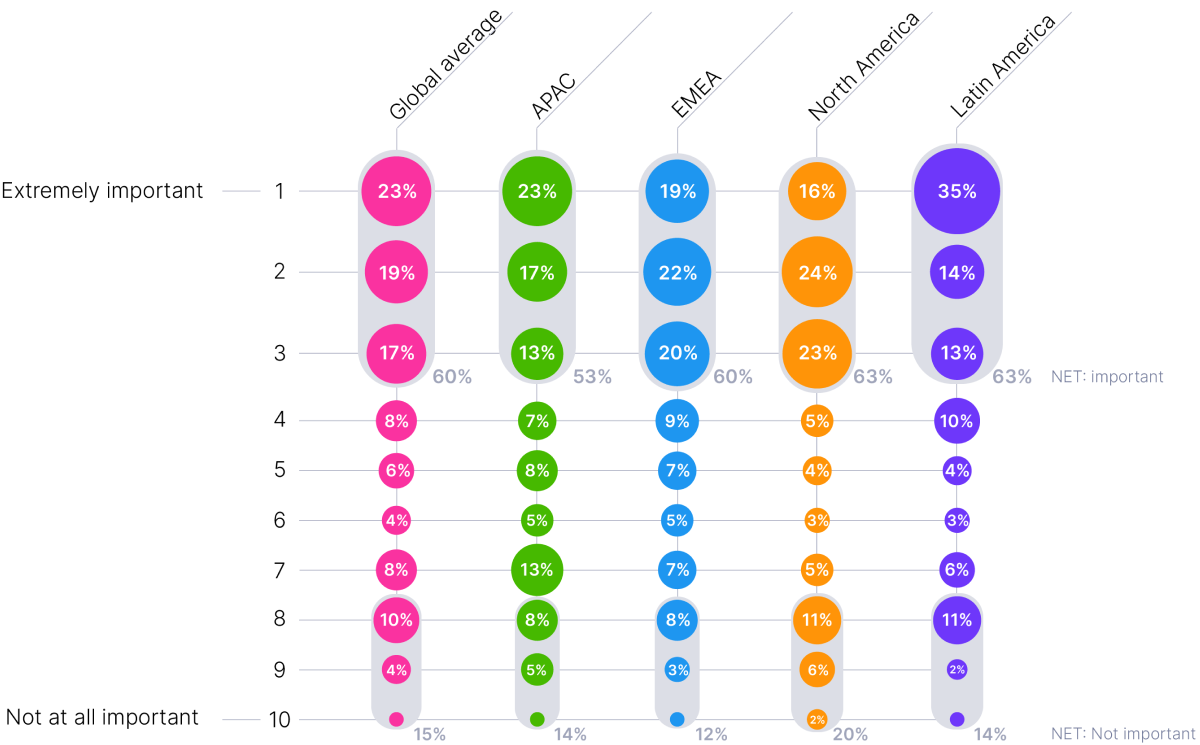
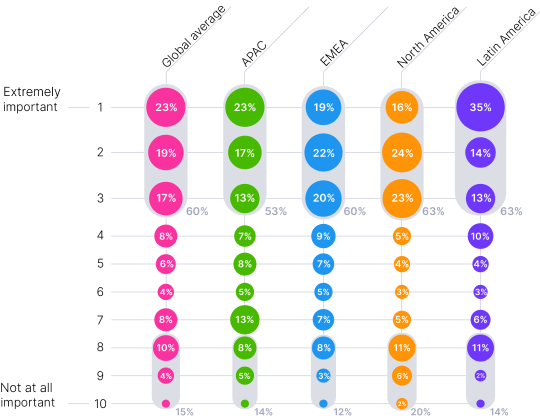
On average, 40% of global marketers don’t believe understanding cross-platform reach is important when assessing whether campaigns reach their intended audience. In Asia-Pacific, that rises to 47%. Given how fragmented the modern media landscape is, this number is surprising and notable.
Importance de comprendre la portée multiplateforme pour mesurer le succès de l'atteinte du public cible
L'efficacité de la portée dépend de la qualité des données d'audience
Quality audience data is at a premium–especially as third-party cookies and mobile advertising IDs (MAIDs) become obsolete. It makes sense then that only 23% of marketers strongly agree that they have the quality audience data they need to get the most out of their media budgets. In Latin America, the percentage is higher, at 26%.
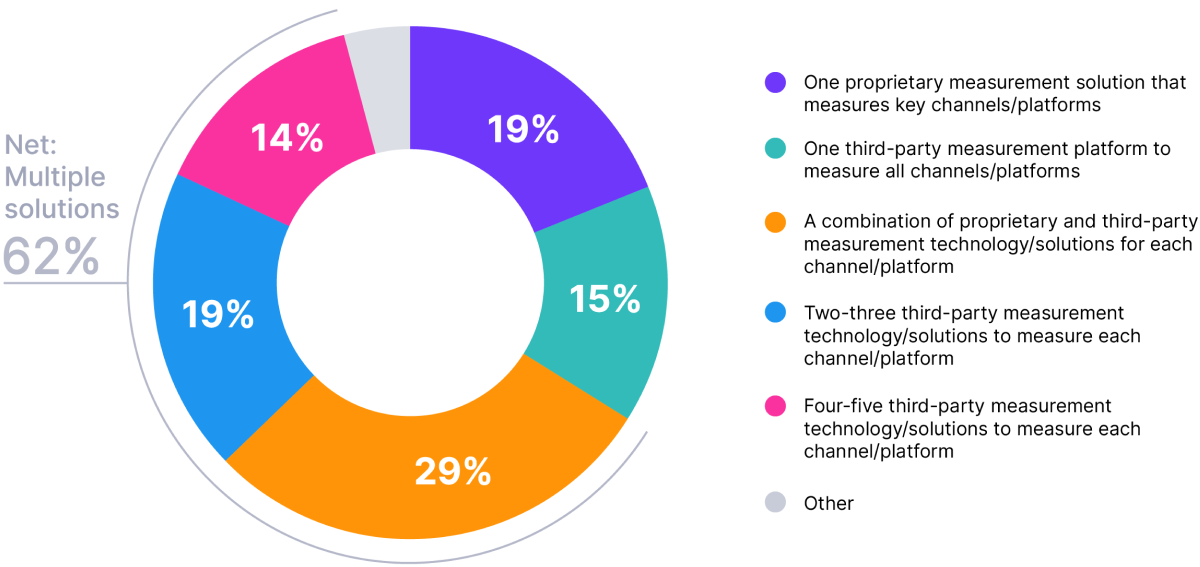
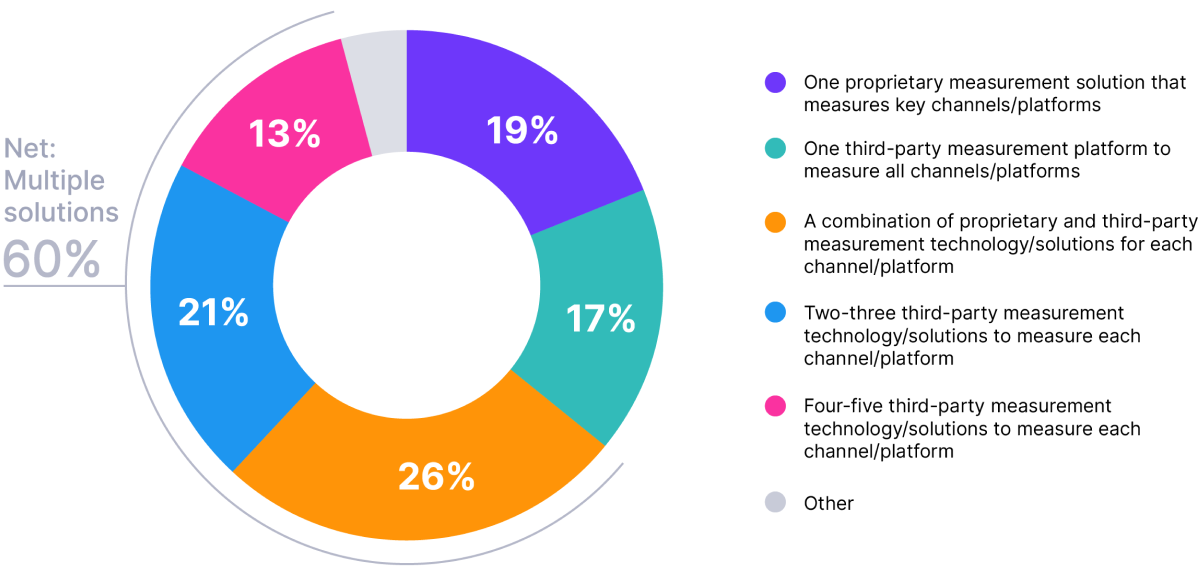
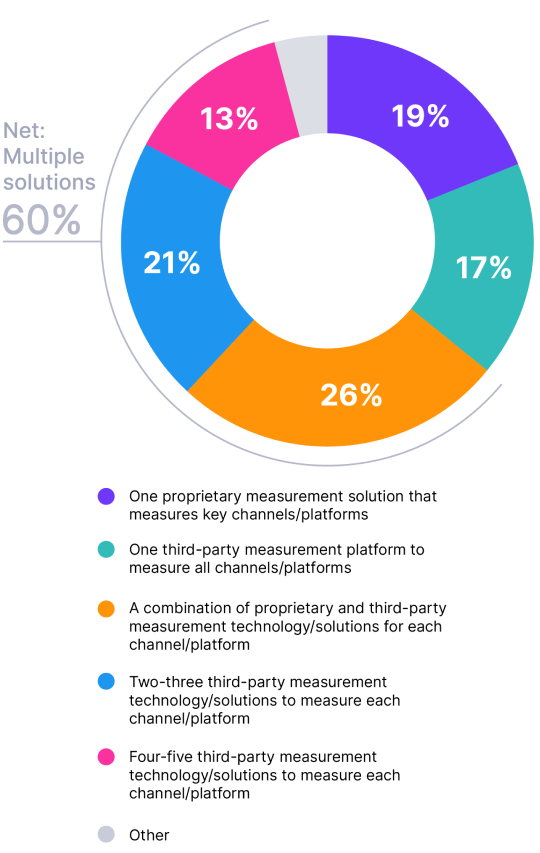
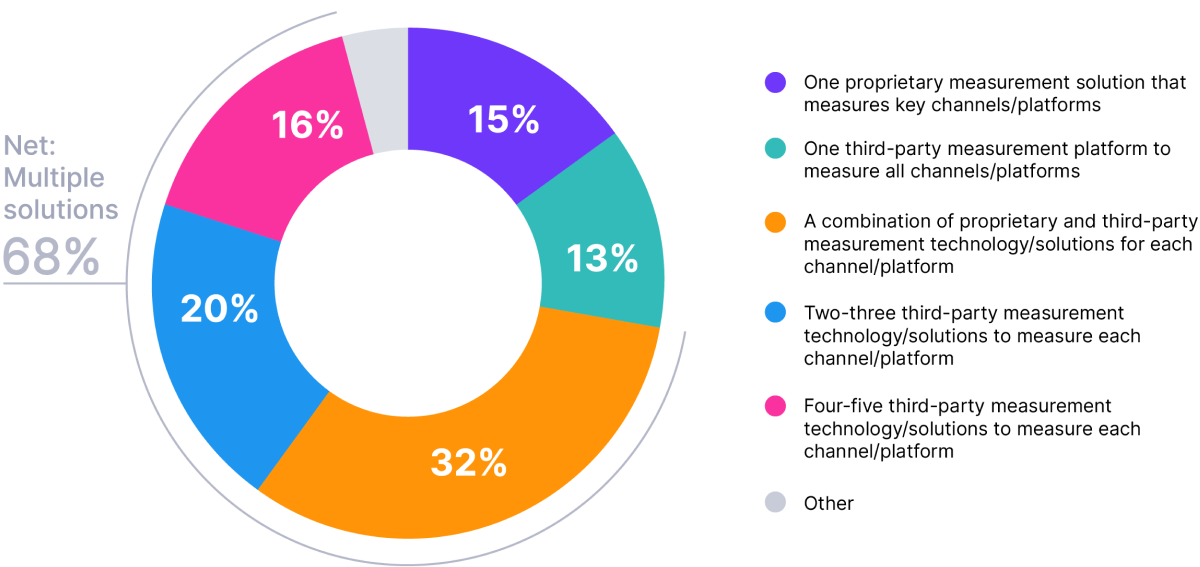
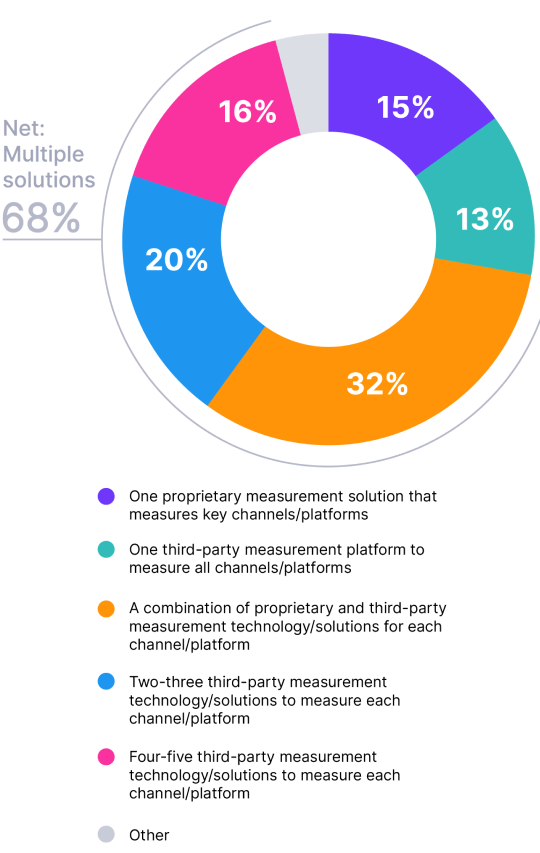
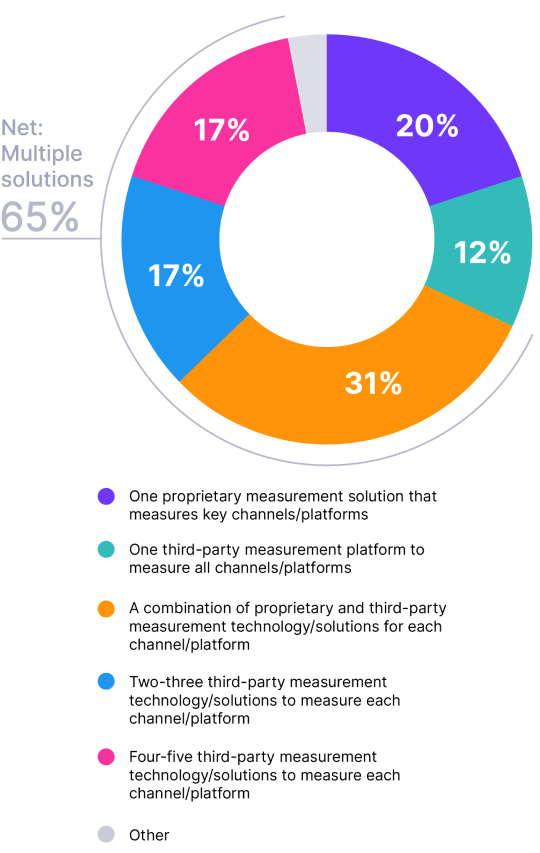
Les outils spécifiques à chaque canal fournissent des informations isolées
Historically, linear and digital measurement have relied on different methodologies. So, understandably, marketers have turned to multiple, channel-specific tools. On average, 62% of marketers globally use multiple measurement solutions to arrive at cross-media measurement, with 14% leveraging four to five. Just 34% report using one platform for cross-measurement needs: 19% have their own proprietary solution, and 15% use a third-party tool.
Approches utilisées pour réaliser des mesures cross-média


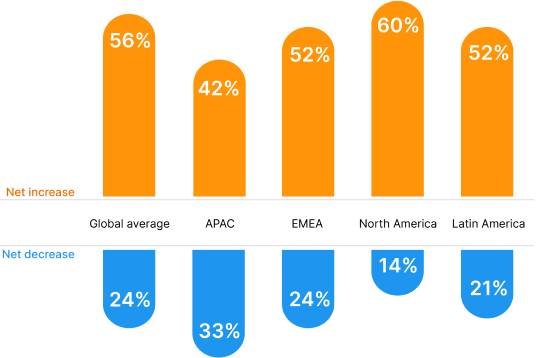
Les investissements dans les technologies de l'information et de la communication sont en baisse
In addition to using less of their martech, marketers now plan to pull back on additional investment in 2023. On average, 24% of global marketers cite reducing martech investments to some degree, with 12% planning cuts of 150% or more.
Investissements prévus dans les technologies de marketing au cours des 12 prochains mois

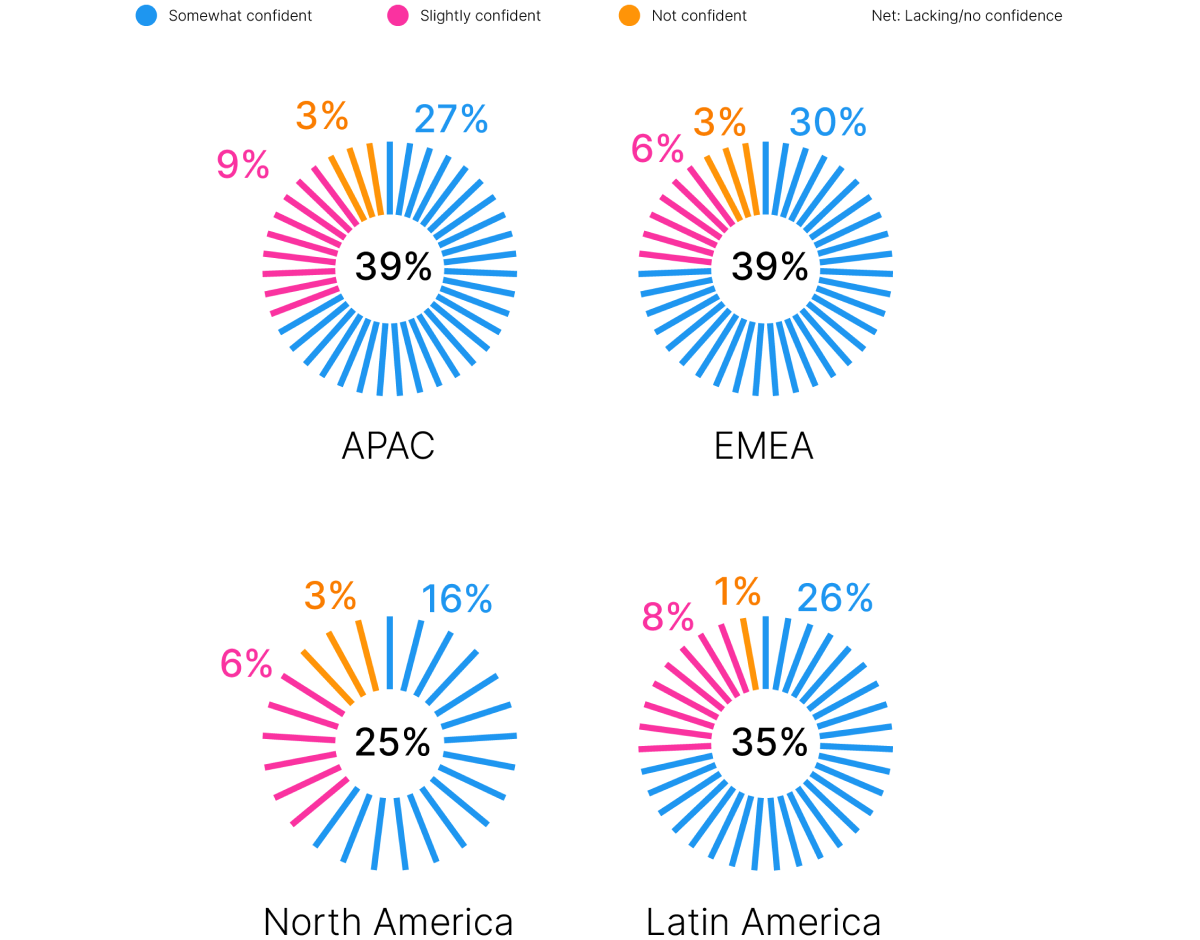
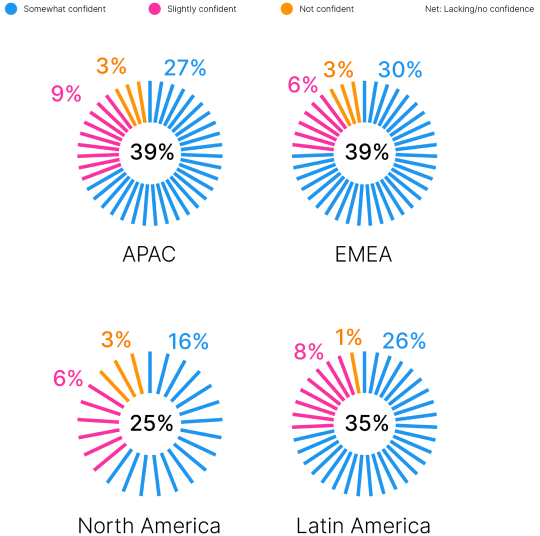
As audiences increase their time with digital devices, emerging channels and streaming content, advertisers and agencies will need measurement that provides comparable data across devices and platforms. What’s more, they need accurate data that doesn’t duplicate viewership while audiences constantly toggle between screens. This comprehensive view across linear and digital platforms will deliver a precise look at audience and impact, which should improve their confidence in marketing investments.
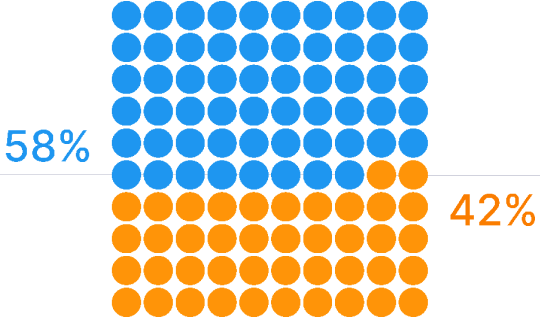
The importance of comparable, person-level measurement isn’t lost on global marketers—71% say comparability is extremely or very important in their cross-media measurement. Arriving at comparable, deduplicated measurement, however, remains a challenge.
Confidence in current solutions delivering comparable, deduplicated cross-media measurement
Plenty is vying for marketers’ attention and budgets. The key is knowing what to prioritize, and how.

Nos recommandations
1
Attention au sous-investissement dans le capital marque
Marketers are always asked to do more with less, even without threats of a recession. The economic uncertainty, however, adds pressure to protecting brand equity and sharpens the need for efficient, targeted and measured ad spending. Marketers may just have less budget to do it all.
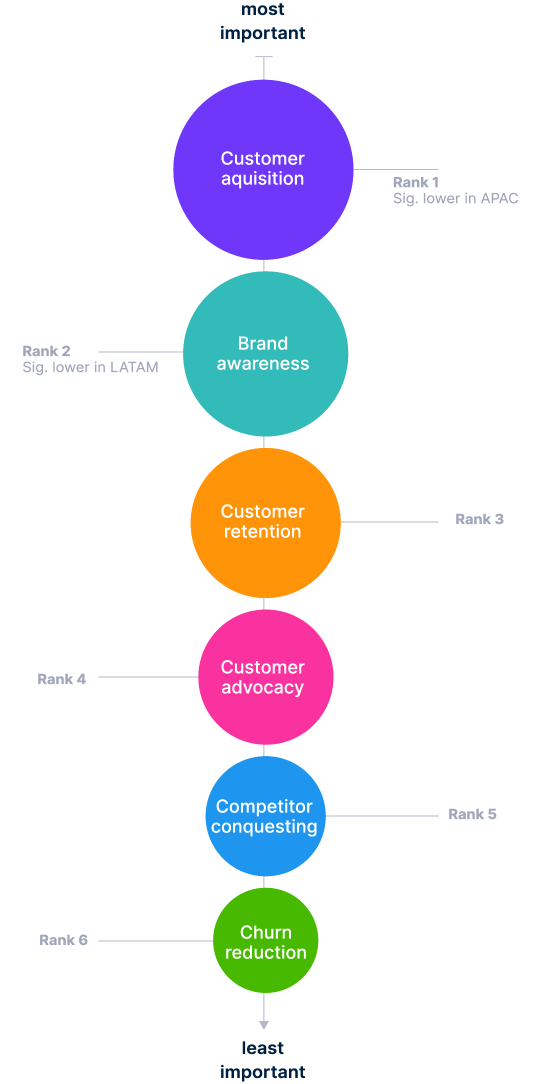
If that wasn’t hard enough, there’s another big consideration: Most brands were already under-spending—by a median of 50%— and losing opportunities to achieve their maximum ROI in 2022. Reducing spending more could hurt ROI even further. It may also have a negative impact on marketers’ top objectives for 2023: customer acquisition and brand awareness.
Principaux objectifs de marketing pour 2023

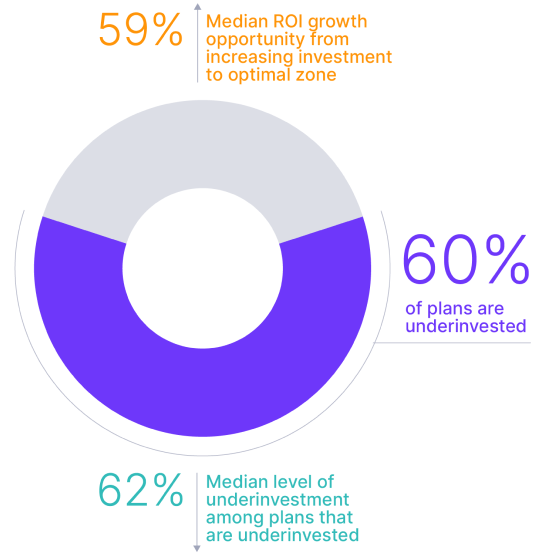
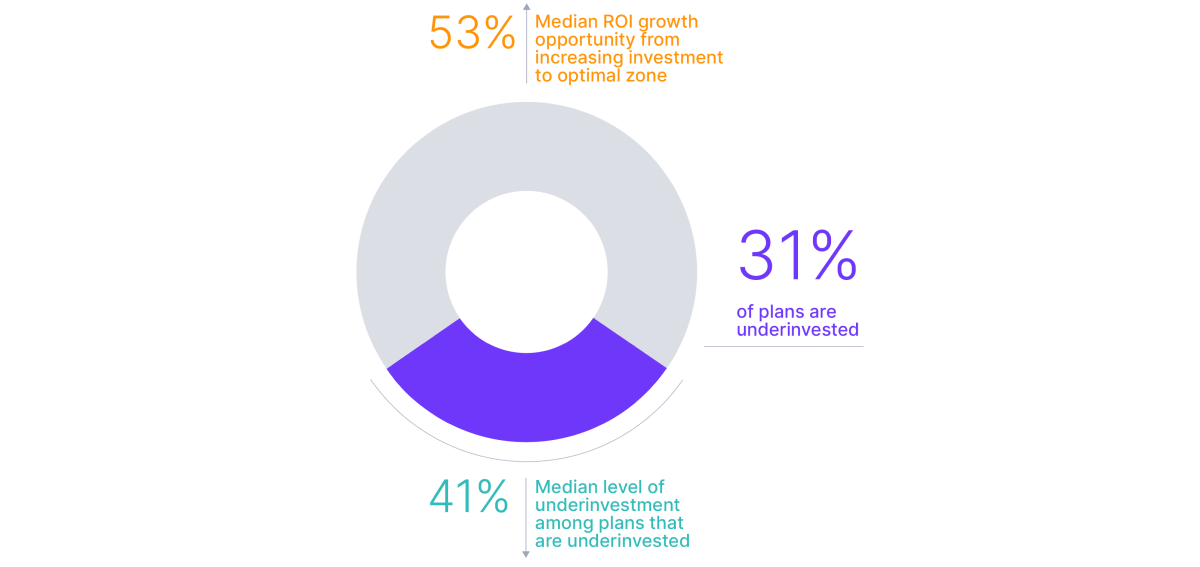
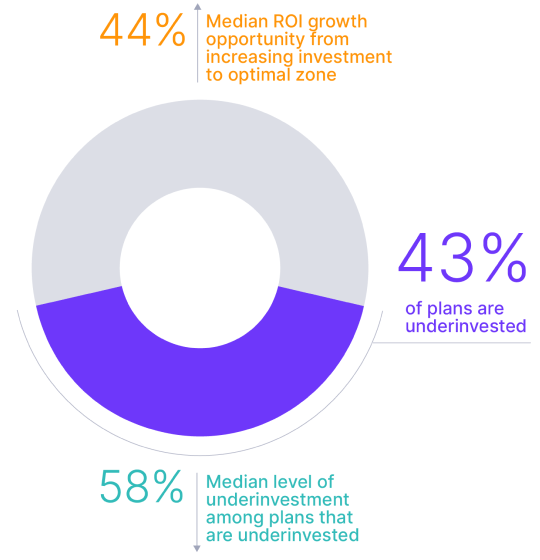
In digital channels where engagement is rising, under-spending is even higher. For example, May 2022 data from Nielsen’s Predictive ROI Database showed that 66% of global media plans were under-invested for digital video. But marketers that close the spending gap and optimize their digital video investments can improve ROI by a median of 51%.
Une sous-utilisation généralisée des crédits empêche un retour sur investissement maximal


2
Adopter un état d'esprit de mesure comparable
Audiences have spoken: Digital video—in all of its forms—is the future of how audiences will engage with content. This shift calls for transformative change in measurement. Marketers know how important comparable metrics are to understand the effectiveness of their ad spending, but they’re still too reliant on tools that give only a limited view of performance. To keep pace with the industry’s future, marketers need tools, solutions and metrics that are media-agnostic.
Impressions, for example, are universally applicable across ads, content and platforms. And subminute measurement, which produces individual commercial metrics, brings linear TV and digital video measurement closer to how digital campaign performance is measured.
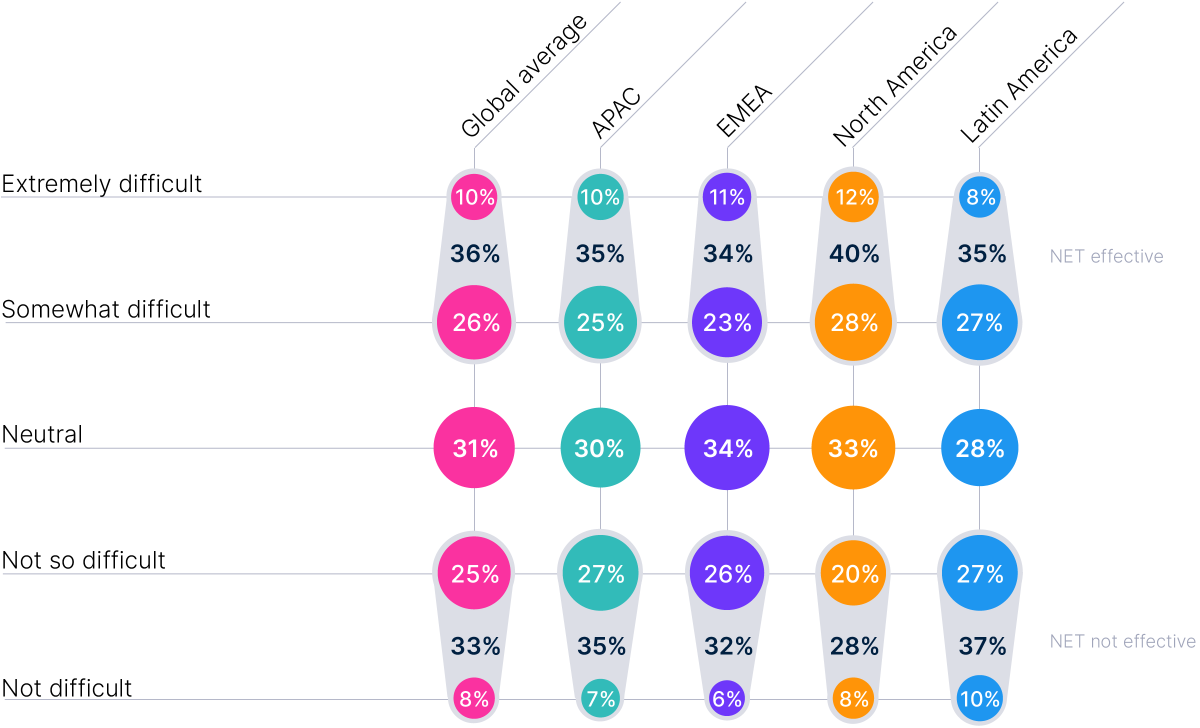
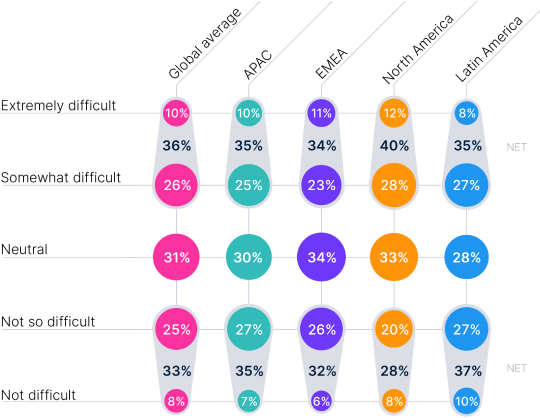
On average, 62% of marketers find it hard to know where to use their ad budgets to reach specific audiences. Even more (69%) agree that digital media and audience fragmentation poses significant challenges to reach their target audiences.
Difficultés de mesure de la publicité OTT/CTV
To be the transformation that marketers want and finally achieve comparable cross-media measurement at the individual level, marketers should prioritize solutions that are focused on delivering measurement that is media agnostic.
3
Augmenter le retour sur investissement en atteignant un plus grand nombre de personnes.
Comprendre les performances des campagnes en temps quasi réel devrait être la voie à suivre dans la quête d'un retour sur investissement maximal. Nous l'entendons souvent : Touchez davantage le bon public et votre retour sur investissement augmentera. Cette affirmation est plus vraie qu'on ne le pense.
In 2022, Nielsen conducted a study involving 15 brands and 82 digital campaigns in the U.S. to verify the correlation between target reach and campaign ROI. When we combined in-flight target measurements from Les classements de la publicité numérique de Nielsen and outcome metrics from Nielsen Attribution, we found one clear truth: Ads that best reached their intended audience generated significantly higher ROI than those that didn’t.
Suivi de la relation entre les publicités ciblées et le retour sur investissement
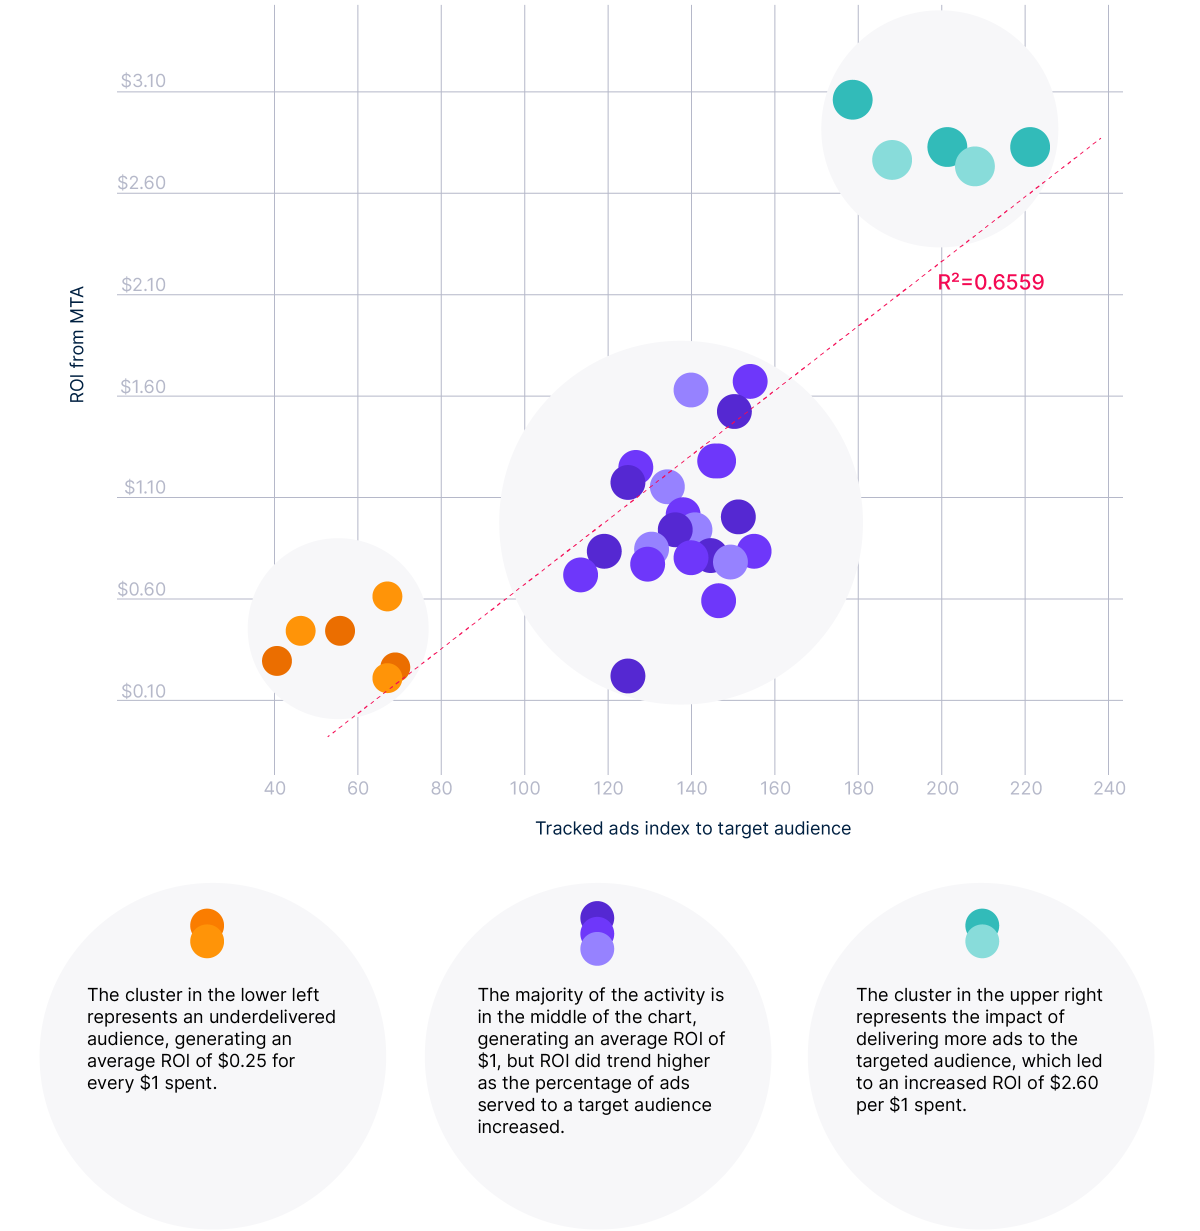
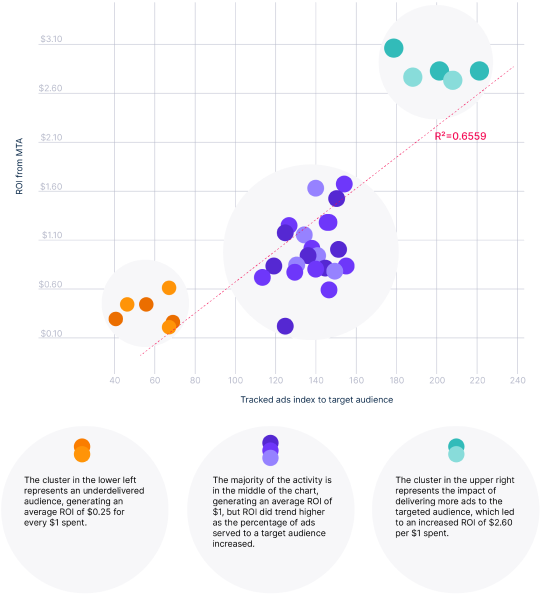
The graph above shows three distinct performance clusters with each bubble representing data for one vendor, for one month, on one campaign.
Cette étude a permis de tirer des enseignements essentiels sur la portée ciblée :
L'augmentation de la portée de la campagne augmente les coûts et ne garantit pas un meilleur retour sur investissement de la campagne.
L'augmentation de la portée ciblée améliorera le retour sur investissement de la campagne
Les annonceurs peuvent utiliser l'analyse de la portée pour mieux comprendre quels publics cibler.
En se concentrant sur les publics les plus précieux
Honing campaign reach is a critical ROI lever. To stave off the complications of fragmented channels and viewerships, marketers need to prioritize measurement solutions that cover all platforms and devices, with near real time insights, so they can capitalize on opportunity and drive impact from the beginning.
Merci d'avoir lu le rapport marketing annuel 2023 de Nielsen !
Vous souhaitez conserver ces informations ?
A propos de ce rapport
This is the fifth annual marketing report Nielsen has produced. It’s also the second to be global. The report leverages survey responses of marketers across a variety of industries whose focus pertains to media, technology and measurement strategies. For this report, we engaged 1,524 global marketing professionals who completed an online survey between Dec. 7, 2022, and Dec. 21, 2022.
In terms of seniority level, we engaged global brand marketers at or above the manager level. These managers work with annual marketing budgets of US$1 million or more across the auto, financial services, FMCG, technology, health care, pharmaceuticals, travel, tourism and retail industries.
Voici la répartition des échantillons par région. Veuillez garder ces tailles d'échantillon à l'esprit lorsque vous lirez et interpréterez les graphiques de ce rapport.
Répondants par région
- APAC : 386 répondants
- EMEA : 374 répondants
- Amérique du Nord : 402 répondants
- Amérique latine : 362 répondants
Total: 1,524
