Nielsen has long been known for counting everyone. Just as we are the measurement standard for the media industry, we are committed to bringing the industry standard for measuring representation and inclusion in programming. As part of our Diverse Intelligence Series, our new report Being Seen on Screen: The Importance of Quantity and Quality Representation on TV explores the state of inclusion and representation in television programming.
Our goal: help the media industry create inclusive content, powered by diverse content creators.
This year, we have expanded our report from the top 300 to the top 1500 programs across broadcast, cable and streaming. We have also included deep dives into new identity groups: Native Americans and people with disabilities.
Points forts du rapport
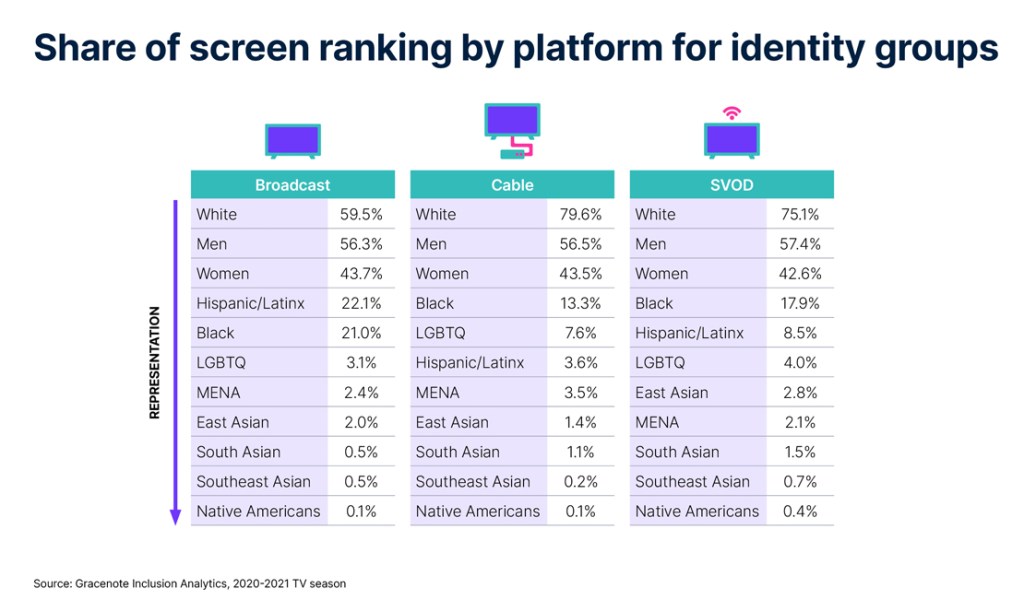
Almost all the major identity groups have some representation in all platforms, but streaming is filling in the gaps for the groups with the lowest share of screen, especially Native Americans and Asians.
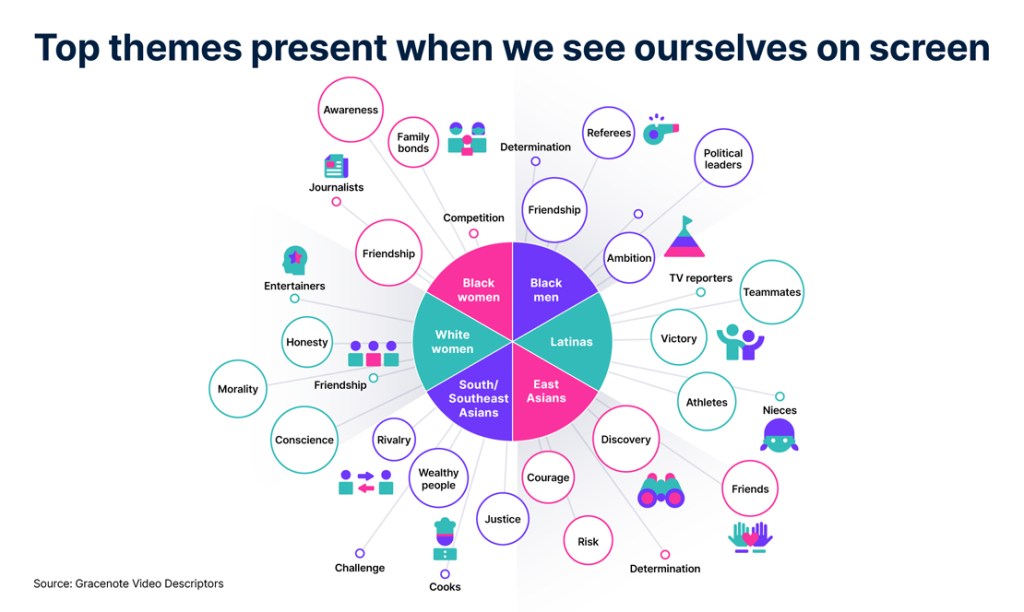
Representation by numbers is important—and so is the context when an identity group is seen on screen. Additionally, the themes in media content help shape perceptions and change beliefs.
Plongez vous-même dans les données
The data underpinning Nielsen’s Inclusion on TV report is pulled from Nielsen’s recently launched Gracenote Inclusion Analytics. And we’ve made the Gracenote Inclusion Analytics interactive tool available below to help those across the media landscape learn more about:
- Inclusion selon le sexe et l'origine ethnique
- Inclusion by program genre e.g. Comedy, Drama, Reality, News
- Inclusion across broadcast, cable and streaming platform
Comment démarrer
- Cliquez sur les titres bleus pour sélectionner les informations que vous souhaitez explorer.
- Click on the buttons on the left to choose the platform: Broadcast, Cable, SVOD (streaming video on demand) or Total (combined view of all platforms)
- Sélectionnez le groupe d'identité dans la liste déroulante de droite.
Comment lire les résultats
- Hover over each of the bars for the specific value. If the value is under 100, that identity group is underrepresented.
- Pour l'indice d'opportunité d'inclusion (IOI)* et le genre : le point médian (100 %) indique que la représentation à l'écran d'un groupe identitaire (par exemple les femmes) est équivalente à leur représentation dans les estimations de la population.
- Pour la part de l'écran (SOS)** : Le pourcentage indique la représentation de chaque groupe identitaire dans les 10 premiers acteurs récurrents d'un programme.
*Indice d'opportunité d'inclusion (IOI) : compare l'indice d'opportunité d'inclusion d'un groupe identitaire (par exemple
**Share of Screen (SOS): Identity group (e.g. women, LGBTQ, Hispanic) representation among the top 10 recurring cast members
Using this solution gives media ecosystem participants visibility into representation of on-screen talent across gender, race, ethnicity and sexual orientation compared with audience diversity. Gracenote Inclusion Analytics also empowers content owners, distributors and brands to make better informed decisions around inclusive content investments.
Interested in more insights? Read our latest Diverse Intelligence Series report to learn how the quality and context of representation matters.