For the first time in U.S. immigration history, the largest number of first-year immigrants is not from a Latin country.
China and India have now replaced Mexico as the largest sources of recent immigrants to the U.S., according to the U.S. Census. At 19.4 million strong and representing 6% of the total U.S. population, Asian-Americans grew 46% from 2002 to 2014 and are now recognized as the fastest-growing multicultural segment in the U.S. The group is expected to continue its growth trajectory, rising 150% between now and 2050 according to U.S. Census projections.
Nielsen’s latest report, Asian-Americans: Culturally Connected and Forging the Future, highlights the unique consumption and media habits that are helping to redefine the American mainstream. Diverse and deeply rooted in their cultural traditions, today’s Asian-Americans value high-quality products and services and are brand loyal shoppers.
YOUNG, EDUCATED AND AMBICULTURAL
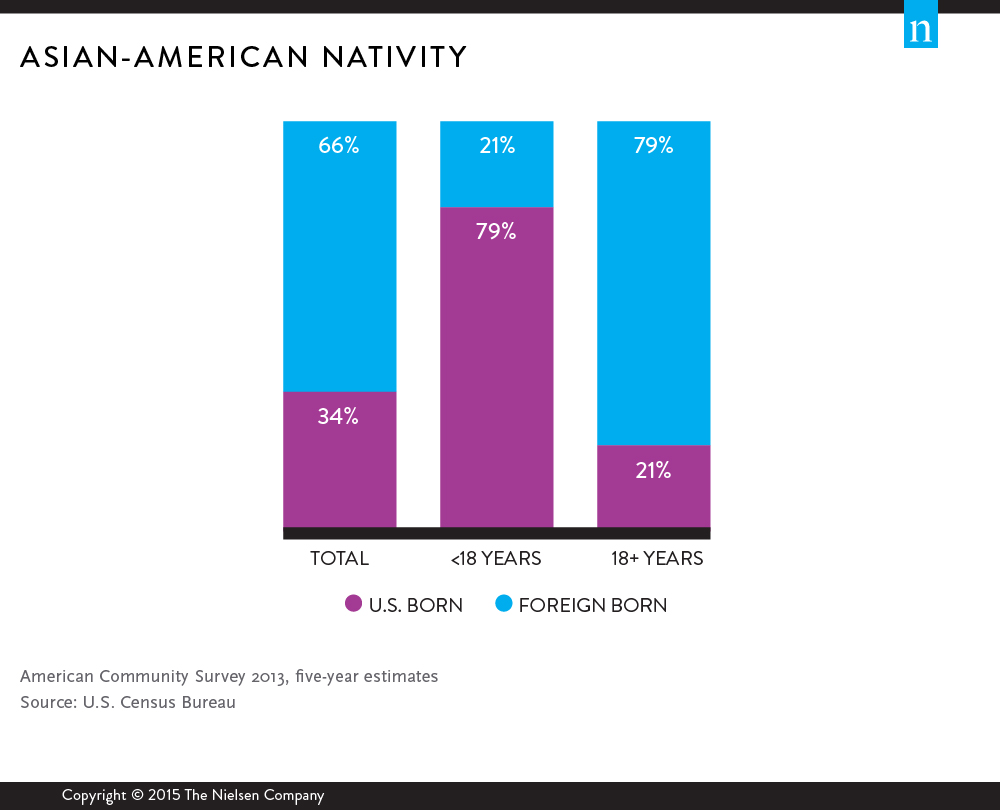
With China and India taking the front seat as important immigration drivers in the U.S., it’s actually the younger Asian-American cohorts who are predominantly U.S. born. Seventy-nine percent of Asian-Americans under 18 are U.S.-born. These younger Asian-Americans, many of whom have been raised in multigenerational households with strong ties to their cultural heritage, are expanding the body of ambicultural consumers able to navigate seamlessly between cultures and are exerting a strong influence on the U.S. mainstream.
Asian-Americans are the most highly educated of all segments. Forty-nine percent of Asian-Americans have a college degree, compared with 28% of the total U.S. population. The average Asian-American household spends 57% more on average for college tuition than non-Hispanic white households. Higher education achievement levels, coupled with more wage earners due to the greater presence of multigenerational households, places the Asian-American median household income ($72,472) 39% higher than the U.S. national average ($52,250), according to the U.S. Census.
While the concentration of Asian-Americans in top metropolitan areas can lead to efficiencies for marketing strategists, buying patterns of many consumers of Southern Asian descent may vary greatly from the behavior of consumers of Southeastern Asian or Eastern Asian descent. These cultural variations and cultural nuances will dictate where and how direct media efforts will be most effective. A few of the top DMAs for Asian-American consumers include Los Angeles, New York, San Francisco, Washington, D.C./Maryland, Chicago and Honolulu.
TREMENDOUS BUYING POWER
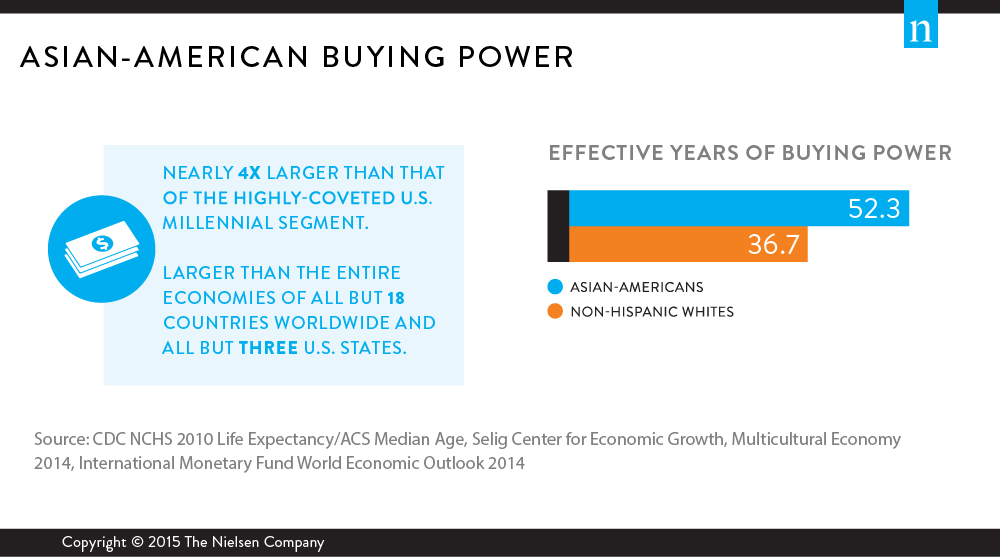
Asian-Americans buying power is currently $770 billion and is expected to increase to $1 trillion by 2018, according to the Selig Center for Economic Growth. From 2000 through 2014 Asian-American buying power increased 180%—nearly triple the increase in buying power for non-Hispanic whites, which was 69% over the same time period. In fact, Asian-American buying power is nearly four times larger than that of the highly-coveted U.S. Millennial group ($200 billion). Put another way, Asian-American buying power is larger than the entire economies of all but 18 countries worldwide, just below the GDP of Turkey and larger than those of Saudi Arabia and Switzerland. It is also larger than the buying power of all U.S. states except California, Texas and New York.
With an average life expectancy of 87.3 years—8.6 more years than non-Hispanic whites (78.7 years) and a lower median age of 35 compared to 42, Asian Americans have substantially greater effective years of buying power (52.3) than non-Hispanic whites (36.7). When planning long-term marketing strategies, these additional 16 years could be a true advantage if loyalty can be established at an early age.
Other findings in the report include:
- Les Américains d'origine asiatique sont des acheteurs sélectifs et dépenseront davantage pour des produits alimentaires qui s'inscrivent dans une longue tradition de bien-être holistique. Les Américains d'origine asiatique sont 31 % plus enclins que la moyenne à acheter des aliments biologiques et 23 % plus enclins à évaluer la valeur nutritionnelle des produits.
- Eighty-eight percent of Asian Americans own credit cards, compared to 66% of the general population.
- Asian-Americans are leaders when it comes to technology, mobile and social media usage. They also watch and download more movies than any other ethnic segment. Overall, 42% of Asian- Americans are more likely to agree that the Internet is a source of entertainment.
For more detail and insight, download Nielsen’s Asian-Americans: Culturally Connected and Forging the Future Report.