From a total viewing perspective, streaming was the clear outlier during the week of Christmas, as Americans watched a total of 183 billion minutes – an all-time high – across the growing range of over-the-top platforms. The aggregate viewing was enough to easily dethrone the 160 billion minutes watched during March 2020 (when stay-at-home restrictions began in the U.S.), as well as the 178 billion minutes watched during the week of Thanksgiving just a month earlier. The spike in streaming viewing also gave streamers 33% viewing share of total TV viewing during the week of Christmas, which was the most as measured by Nielsen.
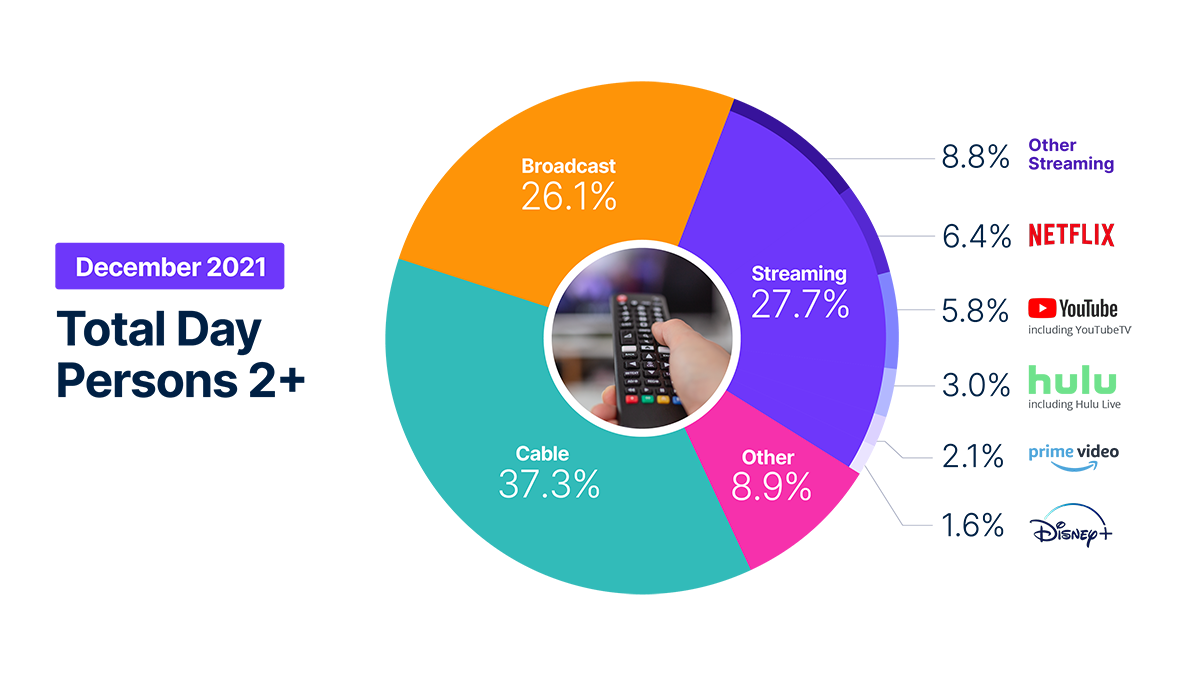
From a reporting standpoint, this month’s edition of The Gauge expands the granularity of the data we provide. Instead of rounding, we have expanded viewing share calculations to display an additional decimal of data. This additional data will make it easier to see month-to-month changes in viewing share. In December, broadcast viewing dropped one share point and the “other” category, which includes video on-demand content, cable set top box streaming, gaming, and DVD usage, gained 1.6% share on the strength of video gaming, during what could be considered the “premiere season” in that category. Overall streaming was fairly flat for the month, remaining consistent with 28% share.


Schauen Sie sich das Video an, um zu hören, wie Brian Fuhrer, SVP, Product Strategy bei Nielsen, einen Blick hinter die Kulissen einiger der Veränderungen bei der Betrachtung von The Gauge wirft.
METHODOLOGY AND FREQUENTLY ASKED QUESTIONS
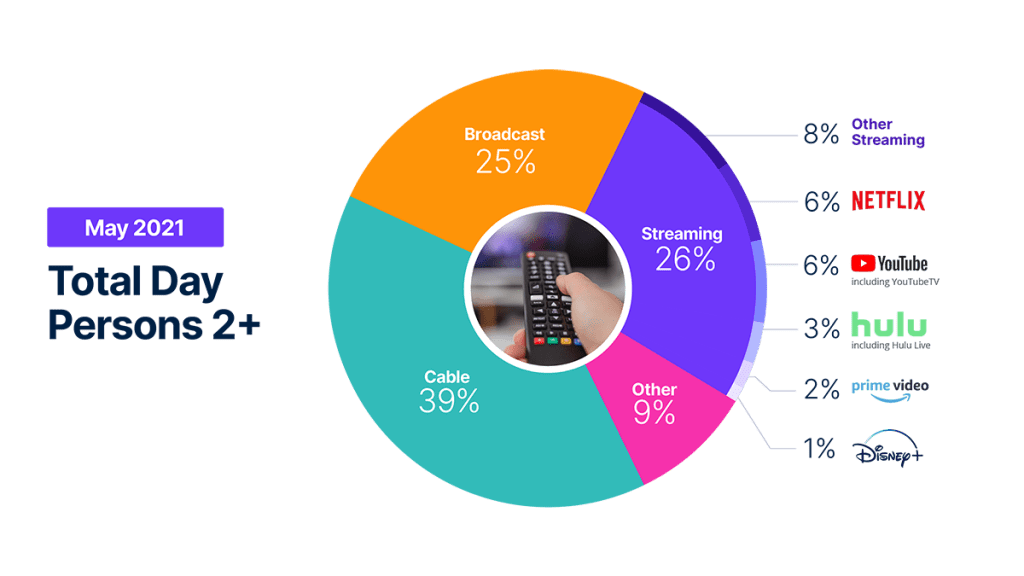
The Gauge bietet eine monatliche Makroanalyse der Art und Weise, wie die Verbraucher auf Inhalte über die wichtigsten Fernsehübertragungsplattformen zugreifen, einschließlich Rundfunk, Streaming, Kabel und andere Quellen. Sie enthält auch eine Aufschlüsselung der wichtigsten einzelnen Streaming-Anbieter. Das Diagramm selbst zeigt den Anteil der einzelnen Streaming-Anbieter an der gesamten Fernsehnutzung nach Kategorien.
Die Daten für The Gauge werden aus zwei separat gewichteten panels abgeleitet und zur Erstellung der Grafik kombiniert. Die Streaming-Daten von Nielsen stammen von einer Teilmenge der Streaming-Meter-fähigen TV-Haushalte innerhalb des nationalen panel. Die linearen TV-Quellen (Rundfunk und Kabel) sowie die Gesamtnutzung basieren auf der Betrachtung des gesamten panel von Nielsen.
All the data is based on a specific time period for each viewing source. The data, representing a 5 week month, includes a combination of Live+7 for weeks 1 – 4 in the data time period. (Note: Live+7 includes live television viewing plus viewing up to seven days later. Live +3 includes television viewing plus viewing up to three days later.)
Innerhalb von The Gauge umfasst "Sonstige" alle anderen Fernsehsendungen. Dazu gehören in erster Linie alle anderen Abstimmungen (nicht gemessene Quellen), nicht gemessenes Video-on-Demand (VOD), Streaming über eine Kabel-Set-Top-Box, Spiele und die Nutzung anderer Geräte (DVD-Wiedergabe). Da beim Streaming über Kabel-Set-Top-Boxen die jeweiligen Streaming-Anbieter nicht berücksichtigt werden, sind diese in der Kategorie "Sonstige" enthalten. Die Gutschrift der einzelnen Streaming-Anbieter über Kabel-Set-Top-Boxen ist ein Ziel, das Nielsen im Zuge der Weiterentwicklung seiner Streaming-Meter-Technologie weiter verfolgt.
Die unter "Sonstiges Streaming" aufgelisteten Streaming-Plattformen umfassen alle Video-Streaming-Angebote mit hoher Bandbreite im Fernsehen, die nicht einzeln aufgeschlüsselt sind.
Yes, Hulu includes viewing on Hulu Live and Youtube includes viewing on Youtube TV.
Verschlüsseltes Live-TV, auch bekannt als verschlüsseltes lineares Streaming, ist sowohl in den Gruppen Rundfunk und Kabel (lineares Fernsehen) als auch unter Streaming und anderen Streaming-Anwendungen, z. B. Hulu Live, Youtube TV, andere Streaming-MVPD/vMVPD, enthalten. (Anmerkung: MVPD, oder Multichannel Video Programming Distributor, ist ein Dienst, der mehrere Fernsehkanäle anbietet. vMVPDs sind Distributoren, die lineare (TV-)Inhalte, die von großen Programmnetzen lizenziert wurden, in einem eigenständigen Abonnementformat zusammenfassen und über Geräte mit einer Breitbandverbindung zugänglich machen).