电视机一直是家庭中的一块磁铁,它将朋友和家人聚集在一起,享受娱乐和彼此的陪伴。如今依然如此,但实体电视机已不仅仅是传统节目的窗口。在我们的媒体饮食中,直播、定时收看电视仍然是固定的节目,但到今年年底,流媒体将占美国消费者总电视时间的三分之一。
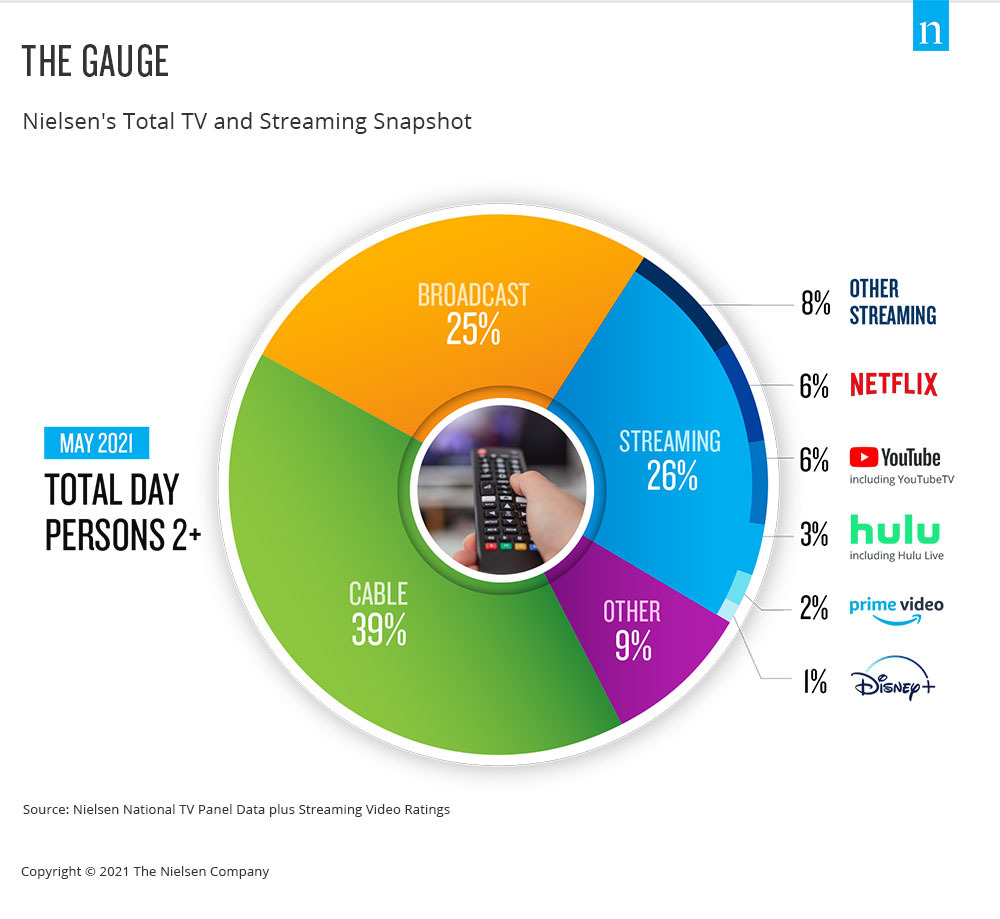
Few areas of the media landscape have been in focus over the past year as streaming video content has, and the TV set is a key portal for that engagement. There is no shortage of news and hype about the streaming landscape, as well as how streaming engagement has dramatically altered video viewing, as it now accounts for 26% of total TV usage. While that statistic is telling on its own, it doesn’t contextualize streaming usage within the broader usage of TV.
From a media industry perspective, nothing is more valuable than accurate, comparable data. And as audiences no longer see a difference between traditional TV, streaming and digital, measurement shouldn’t either. That’s where the Gauge, Nielsen’s total TV and streaming snapshot, comes in. This important step forward in the journey toward true cross-platform measurement and Nielsen ONE simplifies TV usage, illustrating television consumption behavior in a single graphic. With this view, to be updated monthly, industry participants will be able to see critical behavioral shifts and consumer trends with respect to total TV viewing. Additionally, the Gauge tracks “other” use of the TV, such as via game consoles, to give an accurate view of what people are doing in their dens and living rooms.
Importantly, the Gauge does more than simply chart streaming behavior within U.S. homes that have the ability to stream. The snapshot represents streaming across all television homes, which means that the share of streaming more accurately represents consumer behavior in a way that’s easy to describe and understand. The new representation also shows select streaming distributor shares against the total television universe so it provides better comparability within television usage.
跟踪流媒体消费的增长情况,并将其与其他电视使用情况一并审视,对于电影公司、电视网、广告商、代理商和行业团体寻求明确消费者所接触的各种视频内容至关重要。
尼尔森的受众测量方法利用了具有地域代表性的真人小组和大数据,是为未来的媒体消费而打造的。有了the Gauge,电视消费的未来一目了然。
For more information visit The Gauge.
方法
- Streaming via cable set top boxes does not credit to the respective streaming distributors, but instead is included in the “all other” group.
- Data used is derived from two separately weighted panels and combined to create the infographic. Streaming data comes from a subset of TV households in the national TV panel that are enabled with the streaming meter, while linear sources as well as total usage are based on viewing from the overall TV panel.
- 编码的线性流媒体既反映在线性(广播、有线)组中,也反映在各自的线性流媒体应用程序(如 Hulu Live、YouTube TV、其他流媒体 MVPD/vMVPD 应用程序)下
