TV has changed dramatically in recent years. New devices, distributors, streaming platforms, subscription models, and formats are transforming the industry and empowering viewers. But there’s one thing that hasn’t changed: People love to watch TV together.
It depends on the occasion, of course—what the program is, the time of day, the size of the screen, what room it’s in, the size of the family and whether anyone simply happens to be around. But people get together today to watch the 超级碗 or The Bachelorette for the same reason they got together to watch M*A*S*H or the Apollo 11 moon landing half a century ago: to have someone to share the experience with.
In the lingo of the media industry, that’s known as co-viewing. Let’s examine why it’s so important for measurement companies to get it right.
人们多长时间一起看一次电视?
在尼尔森,我们对共同收视的研究由来已久。我们历史悠久的测量解决方案一直以人为基础,即使在只有少数几个主要广播网络的时候也是如此。因此,我们一直都有可靠的真实来源来衡量联合收视。如今,在全美家庭中,47%1 的线性电视和联网电视(CTV)是由多人同时消费的。
Today, there’s virtually no difference in co-viewing rates between linear TV and CTV, but it wasn’t always the case. Back in 2017, we ran a study with Roku and found a significant gap in co-viewing between linear TV (48%) and OTT (34%). Since then, smart TVs have become more widespread and large screens more affordable. And, increasingly, consumers don’t make the distinctions between linear and streaming or TV and digital. It’s all TV.
But that doesn’t mean that there aren’t any variations and that the same co-viewing factor can be applied across the board. There’s more co-viewing during primetime and on weekends, for sports and children programming, among men, young adults and in houses with more children. It also matters where the TV is located inside the house. Every case is different, and the only way to properly account for co-viewing is to measure it directly or model it separately for every ad impression.
为什么要关心人们是否在一起看电视?
Most brands want to reach people, not households—and certainly not faceless devices. Wholesale ad impressions are nice, but they’re not enough. When they buy media, advertisers and their agencies spend top dollars to reach specific demographic targets (like 18-34 year-old women in Philadelphia, or 55+ in Arizona) or advanced audiences (like EV drivers who buy organic). They need guarantees that their ads are reaching the right people, and measuring co-viewing gets to the heart of that question.
就媒体公司而言,他们需要知道谁在观看他们的内容,以便了解受众、优化节目制作并为广告库存合理定价。例如,如果一个新节目在年轻人中的表现特别好,他们就可以订购新一季的节目,为类似节目开绿灯,并培养一批小众追随者,通过货币化来增加订户或吸引急于接触这些观众的广告商。
在当今高度分散、竞争异常激烈的电视领域,媒体公司不再出售 "吨位",广告商也不再购买无差别的 "眼球"。他们都需要测量解决方案,以帮助他们重复观众(在设备内和设备间)、计算目标广告投放、优化到达率和频率,并改进关键的活动绩效指标(如目标演示有效率)。没有个人层面的测量,就无法实现这些目标。
尼尔森如何衡量共同观看?
The most direct way to measure co-viewing is to monitor TV viewership at the individual level. That’s the case with our National TV Panel and top Local TV Markets. In these markets, our panelists “check-in” to the audience. But to add more depth and stability to our audience solutions—and provide more visibility into smaller audiences in smaller TV markets—we’re increasingly relying on big data based on ACR (for smart TVs) return-path data (for cable and satellite providers), or device and context identifiers (for ad impressions). And those technologies only capture viewing information at the household level.
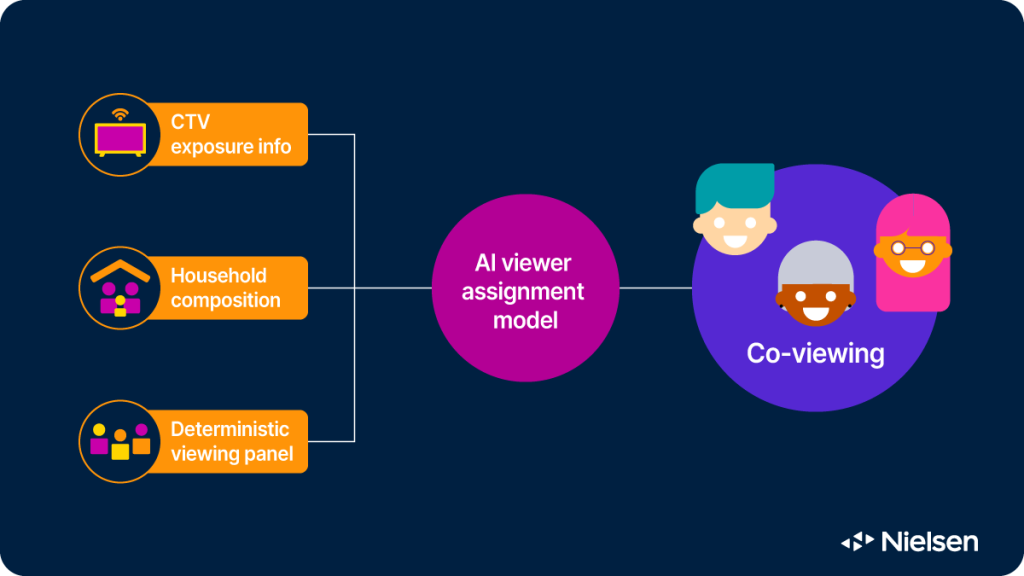
Nielsen is able to determine who is watching thanks to a process called Viewer Assignment that was developed a decade ago and has since been continuously refined. It uses advanced statistical techniques to match faceless viewing data from big data sources (like Roku, Vizio, Hulu, Netflix, YouTube and others) to our persons-level panel data for every possible viewing event and ad impression. The match is based on similarities in viewing behavior (down to the program level) as well as geography, household composition, device type and location inside the house, time of day, day of week, and other key predictors. The model never stops learning, and we’re constantly validating its performance to make sure it’s as close to reality as possible.
掌握面板数据对充分利用这些新数据源大有裨益,但必须认识到,像 "观众分配 "这样的过程并不能弥补所有观众数据缺失的情况。有时,我们在收视数据中看不到可靠的匹配数据,或者没有现成的家庭组成数据。在大约 9% 的 CTV 数据中,即使是简单的观众人口统计数据(如年龄和性别)也很难分配。在这种情况下,尼尔森依靠强大的预测模型来告知和提供观众分配。
下一步是什么?
最近的方法论突破帮助我们为更多的广告投放分配了观众特征--在此过程中大大提高了我们衡量到达率的能力。我们的模型不断从尼尔森的海量数据和信号中学习,使我们对观众的预测更加全面。
共同观看一直是电视体验不可或缺的一部分,而且不会很快改变。请确保它也是您衡量策略中不可或缺的一部分。
Nielsen’s Need to Know reviews the fundamentals of audience measurement and demystifies the media industry’s hottest topics. Read every article here.
说明
1Nielsen Panel Data


