在过去的一年里,世界可能从未像现在这样依赖互联互通。随着世界上大部分人在家的时间越来越多,技术已经成为从商业、社交聚会到最新娱乐等一切活动的生命线。关于这些领域的文章已经写了很多,但鉴于连通性使数百万美国人能够在家工作,并为全国无数儿童提供了接受虚拟学校教育的机会,可以说虚拟是新的IRL。
That has inspired many Americans to think about where they want to live. Especially if a physical office location is no longer a consideration, the idea of relocation becomes a real option, particularly for those seeking to escape the density of heavily populated urban areas. Many consumers sought temporary solace away from big cities early on, but the prolonged duration of the COVID-19 pandemic has metro-dwellers thinking about more permanent moves, especially as many work-from-home and remote schooling arrangements remain intact.
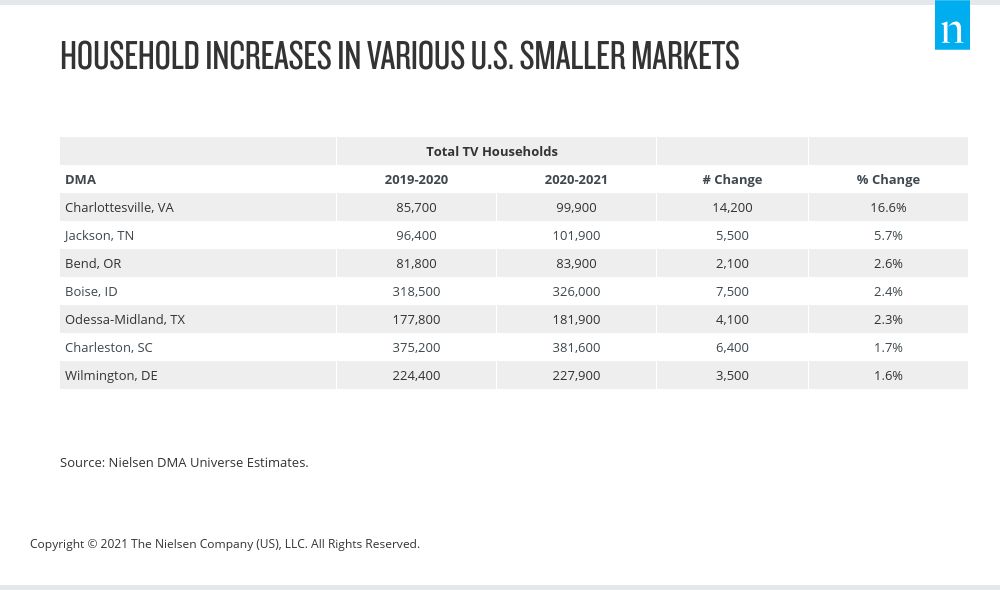
The prospect of moving could have long-lasting implications for the distribution of the U.S. population. According to recent Oliver Wyman research, one in five urban dwellers is planning to move or considering a move because of the pandemic. And we’re already starting to see the shift. In looking at Nielsen’s year-over-year U.S. household data, we can see increases in an array of smaller-sized designated market areas (DMAs). Many of the increases represent changes of less than 2%, but a handful have been more significant, with the Charlottesville, Va., DMA registering a 16.6% increase in households between the 2019-2020 and 2020-2021 universe estimate periods.
这一趋势对于希望在消费者的习惯和生活环境发生变化时与他们保持联系的品牌和广告商来说非常重要。
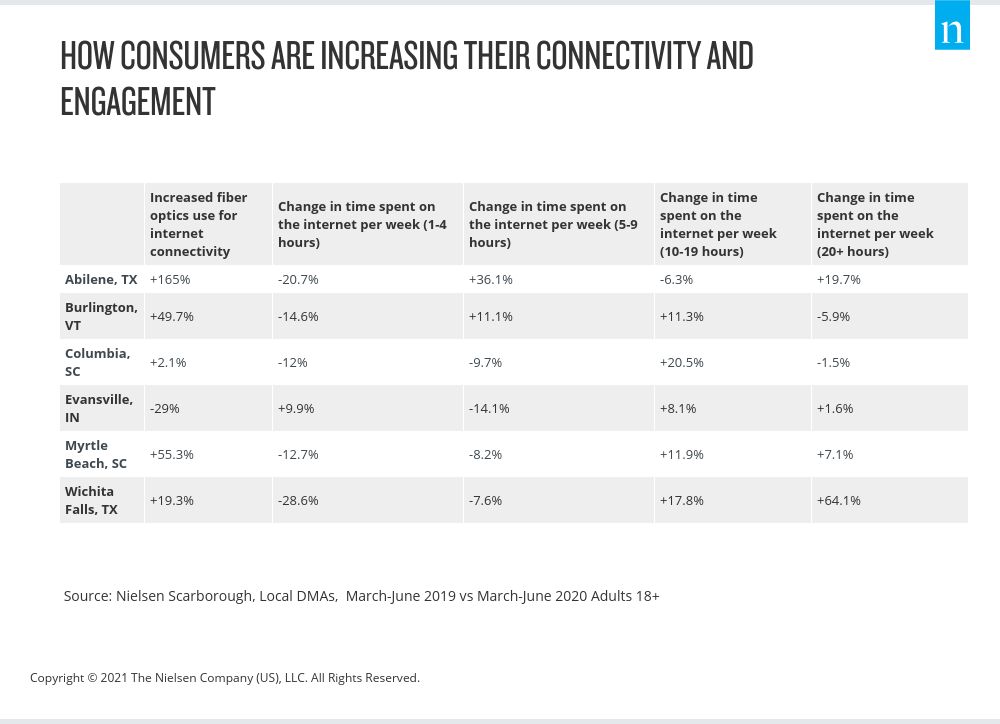
Importantly, many of the country’s lesser-populated DMAs present a valuable opportunity given how digitally engaged their residents are. Whether they’re in cities in Texas, South Carolina, Indiana, Florida or Colorado, consumers in these markets are spending more time connected online. In Abilene, Texas, for example, which is just over 200 miles away from Austin, household use of fiber optics connectivity had increased 165% according to the survey data from Nielsen Scarborough. That connectivity has facilitated a 36% increase in usage of five to nine hours online per week, as well as nearly a 20% increase in usage of 20 hours or more online. In some DMAs, such as Myrtle Beach, S.C., and Wichita Falls, Texas, we’re seeing decreases in internet usage across shorter periods of time and increases in usage across longer periods of time.
除了使用互联网的时间越来越长之外,许多人口稀少地区的消费者也在追随全国趋势,向流媒体和视频点播领域倾斜。截至 2020 年第二季度,美国消费者平均每天使用联网设备的时间为 1 小时 14 分钟,而一年前仅为 50 分钟。其中大部分时间用于观看流媒体内容,根据尼尔森电视测量数据,2020 年 12 月,在具备流媒体功能的家庭中,流媒体占总电视时间的 23%。五大流媒体视频点播(SVOD)平台(Netflix、Amazon Prime、Disney+、Hulu 和 YouTube)占每周流媒体播放时长的 53%,而 "其他 "类别中的无数提供商现在占据了另外的 47%。
Multichannel video programming distributors (MVPDs; traditional cable companies that augment traditional delivery with a streaming app) and virtual MVPDs are newer to the streaming landscape, but accounted for 36% of the “other” category as of July 2020. They’re also gaining in popularity across many of the country’s lesser-populated DMAs, including Abilene, Burlington and Evansville. In Abilene, for example, Nielsen Scarborough survey data shows that consumers’ past 30-day usage of Sling TV (a subscription-based vMVPD) was almost 235% higher than during the previous survey period. Consumers in the Burlington, Vt.-Plattsburgh, N.Y. DMA report an increase of nearly 102%. Comparatively, consumers in Abilene and Burlington report increased or flat usage of the more traditional SVOD services, but the reported increases were notably lower than those reported for vMVPD usage.
Importantly, despite the growing streaming options available to consumers (including free ad-supported offerings), many are focused on premium offerings. For example, according to Nielsen Scarborough data, consumers in Evansville report more than a 5% decrease in using an internet-connected device or app to watch free TV programs. In Myrtle Beach, consumers report a decrease of 26%. In combination with increased stated usage around paid video options, it’s clear that consumers in these DMAs are gravitating toward what interests them rather than what’s free. This speaks volumes about the value of quality content—even as the market is seeing an array of free, ad-supported options come to market. And when you consider that adults 18 and older were spending an average of almost 11-and-a-half hours with media each day as of June 2020, knowing which platforms and programs they’re engaging with—and the markets where they’re engaging—couldn’t be more important.