โทรทัศน์เป็นแม่เหล็กดึงดูดคนในบ้านมาโดยตลอด ซึ่งทำให้เพื่อนฝูงและครอบครัวมารวมตัวกันเพื่อเพลิดเพลินกับความบันเทิงและใช้เวลาร่วมกัน ซึ่งยังคงเป็นจริงอยู่ในปัจจุบัน แต่โทรทัศน์แบบกายภาพได้กลายเป็นมากกว่าหน้าต่างสู่รายการแบบดั้งเดิม การรับชมทีวีแบบสดตามกำหนดเวลาเป็นส่วนหนึ่งในชีวิตประจำวันของเรา แต่การสตรีมกำลังจะกลายเป็นหนึ่งในสามของเวลาการดูทีวีทั้งหมดของผู้บริโภคในสหรัฐอเมริกาภายในสิ้นปีนี้
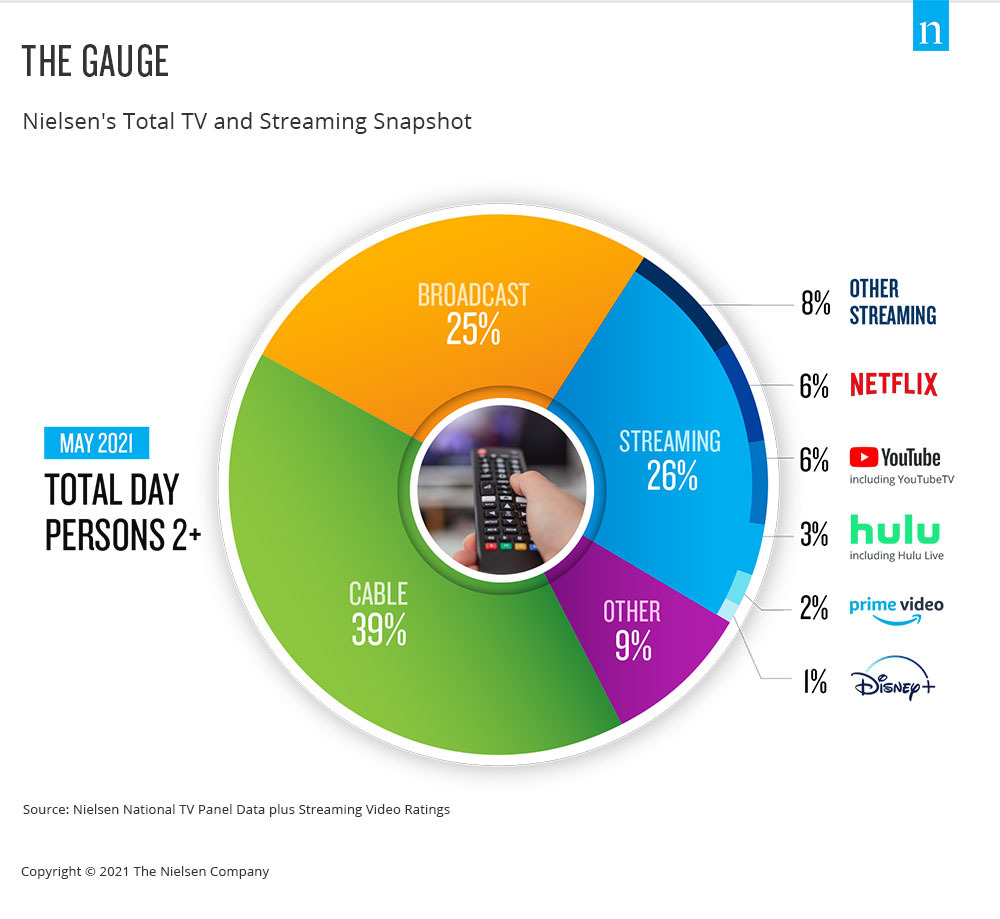
Few areas of the media landscape have been in focus over the past year as streaming video content has, and the TV set is a key portal for that engagement. There is no shortage of news and hype about the streaming landscape, as well as how streaming engagement has dramatically altered video viewing, as it now accounts for 26% of total TV usage. While that statistic is telling on its own, it doesn’t contextualize streaming usage within the broader usage of TV.
From a media industry perspective, nothing is more valuable than accurate, comparable data. And as audiences no longer see a difference between traditional TV, streaming and digital, measurement shouldn’t either. That’s where the Gauge, Nielsen’s total TV and streaming snapshot, comes in. This important step forward in the journey toward true cross-platform measurement and Nielsen ONE simplifies TV usage, illustrating television consumption behavior in a single graphic. With this view, to be updated monthly, industry participants will be able to see critical behavioral shifts and consumer trends with respect to total TV viewing. Additionally, the Gauge tracks “other” use of the TV, such as via game consoles, to give an accurate view of what people are doing in their dens and living rooms.
Importantly, the Gauge does more than simply chart streaming behavior within U.S. homes that have the ability to stream. The snapshot represents streaming across all television homes, which means that the share of streaming more accurately represents consumer behavior in a way that’s easy to describe and understand. The new representation also shows select streaming distributor shares against the total television universe so it provides better comparability within television usage.
การติดตามการเติบโตของการรับชมสตรีมมิ่งและการรับชมควบคู่ไปกับการใช้งานทีวีประเภทอื่นถือเป็นสิ่งสำคัญ เนื่องจากสตูดิโอ เครือข่าย ผู้โฆษณา หน่วยงาน และกลุ่มอุตสาหกรรมต่างๆ กำลังมองหาความชัดเจนเกี่ยวกับเนื้อหาวิดีโอต่างๆ ที่ผู้บริโภคสนใจ
แนวทางการวัดผลผู้ชมของ Nielsen ซึ่งใช้ประโยชน์จากกลุ่มตัวอย่างประชากรจริงและข้อมูลขนาดใหญ่ที่เป็นตัวแทนทางภูมิศาสตร์ ถูกสร้างขึ้นเพื่อการบริโภคสื่อในอนาคต และด้วย the Gauge อนาคตของการรับชมทีวีสามารถมองเห็นได้เพียงภาพเดียว
For more information visit The Gauge.
วิธีการ
- Streaming via cable set top boxes does not credit to the respective streaming distributors, but instead is included in the “all other” group.
- Data used is derived from two separately weighted panels and combined to create the infographic. Streaming data comes from a subset of TV households in the national TV panel that are enabled with the streaming meter, while linear sources as well as total usage are based on viewing from the overall TV panel.
- การสตรีมแบบเข้ารหัสเชิงเส้นจะสะท้อนให้เห็นทั้งในกลุ่มเชิงเส้น (การออกอากาศ เคเบิล) เช่นเดียวกับภายใต้แอพการสตรีมแบบเชิงเส้นที่เกี่ยวข้อง (เช่น Hulu Live, YouTube TV, แอพสตรีมมิ่ง MVPD/vMVPD อื่นๆ)
