TV has changed dramatically in recent years. New devices, distributors, streaming platforms, subscription models, and formats are transforming the industry and empowering viewers. But there’s one thing that hasn’t changed: People love to watch TV together.
It depends on the occasion, of course—what the program is, the time of day, the size of the screen, what room it’s in, the size of the family and whether anyone simply happens to be around. But people get together today to watch the ซุปเปอร์โบว์ล or The Bachelorette for the same reason they got together to watch M*A*S*H or the Apollo 11 moon landing half a century ago: to have someone to share the experience with.
In the lingo of the media industry, that’s known as co-viewing. Let’s examine why it’s so important for measurement companies to get it right.
ผู้คนดูทีวีด้วยกันบ่อยแค่ไหน?
ที่ Nielsen เราศึกษาเรื่องการรับชมร่วมกันมาเป็นเวลานาน โซลูชันการวัดผลในอดีตของเรานั้นอิงตามบุคคลเสมอมา แม้กระทั่งในสมัยที่มีเครือข่ายการออกอากาศหลักเพียงไม่กี่เครือข่าย ดังนั้น เราจึงมีแหล่งข้อมูลที่เชื่อถือได้เสมอมาเพื่อประเมินการรับชมร่วมกัน ปัจจุบัน ในบ้านเรือนทั่วอเมริกา 47%1 ของทีวีแบบเชิงเส้นและแบบเชื่อมต่อ (CTV) ถูกรับชมโดยบุคคลมากกว่าหนึ่งคนในเวลาเดียวกัน
Today, there’s virtually no difference in co-viewing rates between linear TV and CTV, but it wasn’t always the case. Back in 2017, we ran a study with Roku and found a significant gap in co-viewing between linear TV (48%) and OTT (34%). Since then, smart TVs have become more widespread and large screens more affordable. And, increasingly, consumers don’t make the distinctions between linear and streaming or TV and digital. It’s all TV.
But that doesn’t mean that there aren’t any variations and that the same co-viewing factor can be applied across the board. There’s more co-viewing during primetime and on weekends, for sports and children programming, among men, young adults and in houses with more children. It also matters where the TV is located inside the house. Every case is different, and the only way to properly account for co-viewing is to measure it directly or model it separately for every ad impression.
แล้วจะสนใจทำไมว่าคนเราจะดูทีวีด้วยกัน?
Most brands want to reach people, not households—and certainly not faceless devices. Wholesale ad impressions are nice, but they’re not enough. When they buy media, advertisers and their agencies spend top dollars to reach specific demographic targets (like 18-34 year-old women in Philadelphia, or 55+ in Arizona) or advanced audiences (like EV drivers who buy organic). They need guarantees that their ads are reaching the right people, and measuring co-viewing gets to the heart of that question.
บริษัทสื่อจำเป็นต้องทราบว่าใครกำลังรับชมเนื้อหาของตน เพื่อทำความเข้าใจผู้ชม ปรับโปรแกรมให้เหมาะสม และกำหนดราคาโฆษณาให้เหมาะสม หากรายการใหม่ประสบความสำเร็จกับกลุ่มวัยรุ่นเป็นพิเศษ บริษัทสามารถสั่งซื้อซีซันใหม่ เปิดไฟเขียวให้รายการประเภทเดียวกัน และพัฒนากลุ่มผู้ติดตามเฉพาะกลุ่มที่สามารถสร้างรายได้เพื่อเพิ่มจำนวนสมาชิกหรือดึงดูดผู้ลงโฆษณาที่ต้องการเข้าถึงผู้ชมเหล่านั้น
ในภูมิทัศน์ของโทรทัศน์ที่แตกแขนงและแข่งขันกันสูงในปัจจุบัน บริษัทสื่อต่างๆ ไม่ได้ขาย "ปริมาณ" อีกต่อไป และผู้โฆษณาไม่ได้ซื้อ "ผู้ชม" อย่างไม่เลือกหน้า พวกเขาทั้งหมดต้องการโซลูชันการวัดผลที่สามารถช่วยกำจัดผู้ชมซ้ำซ้อน (ภายในและข้ามอุปกรณ์) คำนวณการส่งโฆษณาตามเป้าหมาย เพิ่มประสิทธิภาพการเข้าถึงและความถี่ และปรับปรุงตัวบ่งชี้ประสิทธิภาพแคมเปญหลัก (เช่น อัตราประสิทธิภาพของกลุ่มตัวอย่างเป้าหมาย) คุณไม่สามารถบรรลุวัตถุประสงค์ใดๆ เหล่านั้นได้หากไม่มีการวัดผลในระดับบุคคล
เราจะวัดการดูร่วมกันที่ Nielsen ได้อย่างไร
The most direct way to measure co-viewing is to monitor TV viewership at the individual level. That’s the case with our National TV Panel and top Local TV Markets. In these markets, our panelists “check-in” to the audience. But to add more depth and stability to our audience solutions—and provide more visibility into smaller audiences in smaller TV markets—we’re increasingly relying on big data based on ACR (for smart TVs) return-path data (for cable and satellite providers), or device and context identifiers (for ad impressions). And those technologies only capture viewing information at the household level.
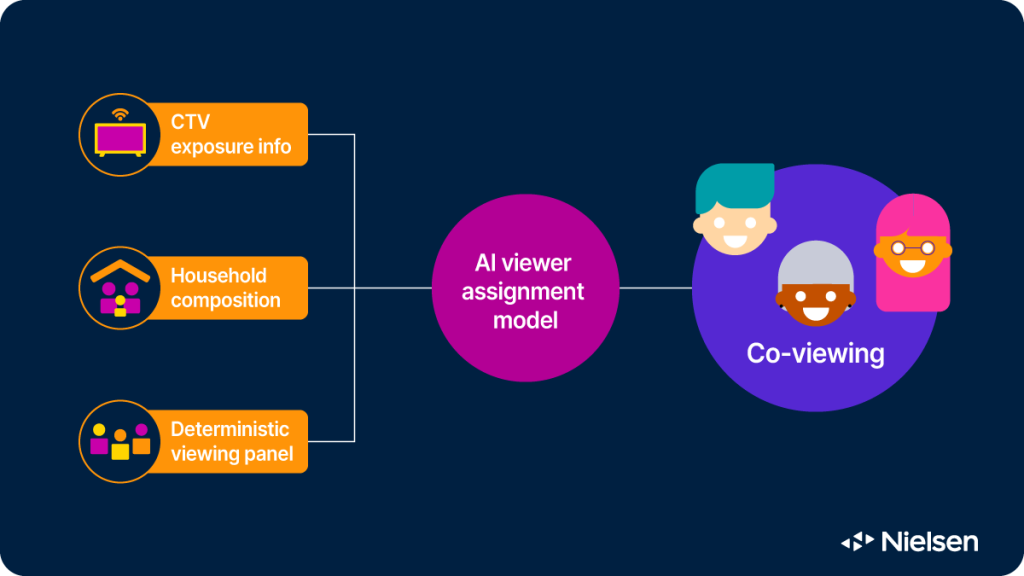
Nielsen is able to determine who is watching thanks to a process called Viewer Assignment that was developed a decade ago and has since been continuously refined. It uses advanced statistical techniques to match faceless viewing data from big data sources (like Roku, Vizio, Hulu, Netflix, YouTube and others) to our persons-level panel data for every possible viewing event and ad impression. The match is based on similarities in viewing behavior (down to the program level) as well as geography, household composition, device type and location inside the house, time of day, day of week, and other key predictors. The model never stops learning, and we’re constantly validating its performance to make sure it’s as close to reality as possible.
การมีข้อมูลแผงข้อมูลในมือช่วยให้ได้รับประโยชน์มหาศาลจากแหล่งข้อมูลใหม่ๆ เหล่านี้ แต่สิ่งสำคัญคือต้องตระหนักว่ากระบวนการเช่นการกำหนดผู้ชมนั้นไม่สามารถชดเชยข้อมูลผู้ชมที่ขาดหายไปได้ในทุกกรณี บางครั้งอาจไม่มีข้อมูลที่ตรงกันอย่างน่าเชื่อถือสำหรับสิ่งที่เราเห็นในข้อมูลการรับชม หรือไม่สามารถระบุองค์ประกอบของครัวเรือนได้อย่างง่ายดาย สำหรับข้อมูล CTV ทั้งหมดประมาณ 9% ยังคงเป็นเรื่องยากที่จะกำหนดข้อมูลประชากรผู้ชมอย่างง่ายๆ เช่น อายุและเพศ ในกรณีเหล่านี้ Nielsen จะใช้โมเดลการทำนายที่มีประสิทธิภาพเพื่อแจ้งข้อมูลและส่งมอบการกำหนดผู้ชม
ต่อไปจะเป็นยังไง?
ความก้าวหน้าทางวิธีการล่าสุดช่วยให้เราสามารถกำหนดลักษณะของผู้ชมให้กับตำแหน่งโฆษณาได้มากขึ้น ซึ่งช่วยเพิ่มความสามารถในการวัดการเข้าถึงในกระบวนการนี้ได้อย่างมาก โมเดลของเราเรียนรู้จากข้อมูลและสัญญาณจำนวนมากของ Nielsen อย่างต่อเนื่อง ทำให้การคาดการณ์ผู้ชมของเราครอบคลุมมากขึ้น
การรับชมร่วมกันถือเป็นส่วนสำคัญของประสบการณ์การรับชมทีวีมาโดยตลอด และจะไม่มีการเปลี่ยนแปลงในเร็วๆ นี้ อย่าลืมให้การรับชมร่วมกันเป็นส่วนสำคัญของกลยุทธ์การวัดผลของคุณด้วย
Nielsen’s Need to Know reviews the fundamentals of audience measurement and demystifies the media industry’s hottest topics. Read every article here.
Notes
1Nielsen Panel Data


