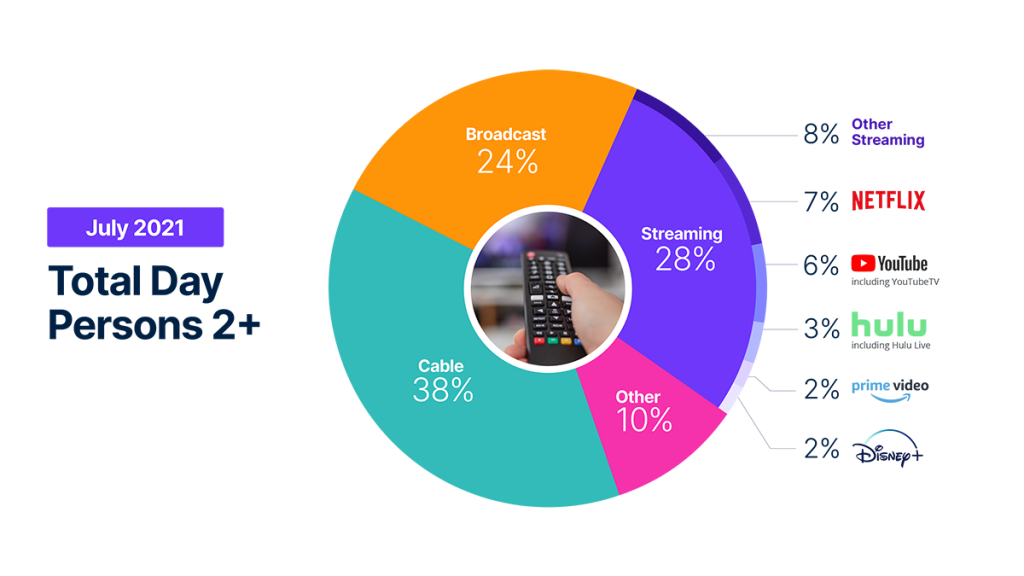
In July, broadcast recaptured television viewers, growing a percentage point thanks to high-profile sporting events coupled with the opening weekend of the Olympics. This shift in viewing meant that cable gave up some ground while streaming also picked up a share point. This is potentially a precursor to August viewership behavior, which will reflect the full duration of the Olympics. At 28% share, streaming benefitted from the continued momentum of the growing stable of streaming services and a healthy influx of new content to the more established services. While it may be too early to call it a trend, streaming has gained 1% with each interval of The Gauge since its release.

Take me to the methodology details below.
“Behind the scenes, sports also likely impacted streaming’s share. This includes many of the Olympics highlights clips, which were posted on YouTube, where we saw some minutes increase. We’ll stay tuned for next month when we’ll have the full impact of the Games to review,” said Brian Fuhrer, SVP, Product Strategy at Nielsen.
Watch the video to hear Brian discuss how sports played an outsized impact on July’s share of television viewership, building from last month’s conclusion of the broadcast season, to the NBA Playoffs on to the Olympics.
วิธีการ
The Gauge เป็นช่วงรายเดือนที่แสดงการใช้งานโทรทัศน์ทั้งหมด (TUT) สำหรับการออกอากาศ การสตรีม เคเบิล และอื่นๆ พร้อมรายละเอียดเจาะลึกช่องการสตรีม
- ทีวีอื่นๆ ทั้งหมดรวมถึง: ส่วนประกอบหลัก ได้แก่ AOT (การปรับแต่งอื่นๆ ทั้งหมด), VOD, การสตรีมผ่านกล่องรับสัญญาณเคเบิล, การเล่นเกม และอุปกรณ์อื่นๆ (การเล่น DVD)
- การสตรีมแบบอื่นคือการสตรีมแบนด์วิดท์สูง (วิดีโอ) ไปยังโทรทัศน์ที่ไม่ได้ระบุไว้
- สถิติ: ส่วนแบ่งตามหมวดหมู่ ส่วนแบ่งของ TUT แยกตามผู้จัดจำหน่ายสตรีมมิ่ง
- Streaming via Cable Set Top Boxes does not credit the respective streaming distributors, but instead is included in the “All Other” group. Crediting individual streaming distributors is something we continue to pursue as an enhancement to our Streaming Meter technology.
- ข้อมูลที่ใช้มาจากแผงข้อมูลสองแผงที่ถ่วงน้ำหนักแยกกันและนำมารวมกันเพื่อสร้างอินโฟกราฟิก ข้อมูลสตรีมมิ่งมาจากกลุ่มย่อยของครัวเรือนที่รับชมโทรทัศน์ในแผงข้อมูลโทรทัศน์แห่งชาติที่เปิดใช้งานด้วยมาตรวัดสตรีมมิ่ง ในขณะที่แหล่งข้อมูลเชิงเส้นและการใช้งานทั้งหมดจะขึ้นอยู่กับการรับชมจากแผงข้อมูลโทรทัศน์โดยรวม
- ข้อมูลทั้งหมดขึ้นอยู่กับแหล่งที่มาของการดูในช่วงเวลาที่กำหนด
- Hulu รวมถึงการรับชมบน Hulu Live ส่วน Youtube รวมถึงการรับชมบน Youtube TV
- การสตรีมแบบเข้ารหัสเชิงเส้นจะสะท้อนให้เห็นทั้งในกลุ่มเชิงเส้น (การแพร่ภาพกระจายเสียง เคเบิล) เช่นเดียวกับภายใต้แอพการสตรีมแบบเชิงเส้นที่เกี่ยวข้อง (เช่น Hulu Live, Youtube TV, แอพสตรีมมิ่ง MVPD/vMVPD อื่นๆ)
- ข้อมูลอิงตามการผสมผสานระหว่าง Live+7 สำหรับสัปดาห์ที่ 1-3 และ Live+3 สำหรับสัปดาห์ที่ 4