Paramount Scores Largest Share Increase Among Distributors as Paramount+ and CBS Affiliates Each Surge More Than 18% in November
Netflix odnotowuje 10-procentowy wzrost dzięki prawie 19 miliardom minut oglądania seriali „Stranger Things”, „The Beast In Me” i „Frankenstein”.
Hallmark wykorzystuje świąteczną ramówkę programową, aby osiągnąć 28-procentowy wzrost oglądalności
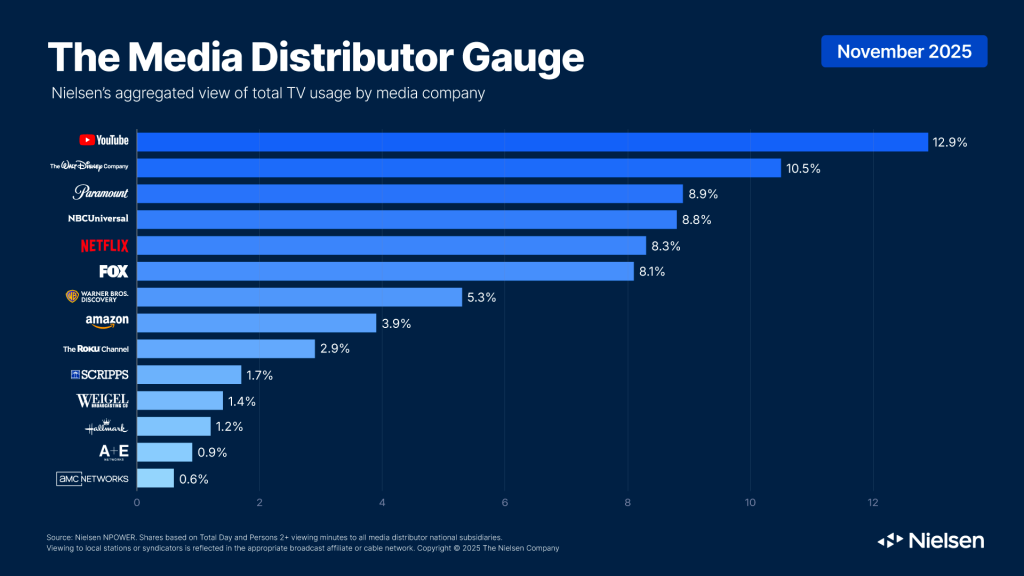
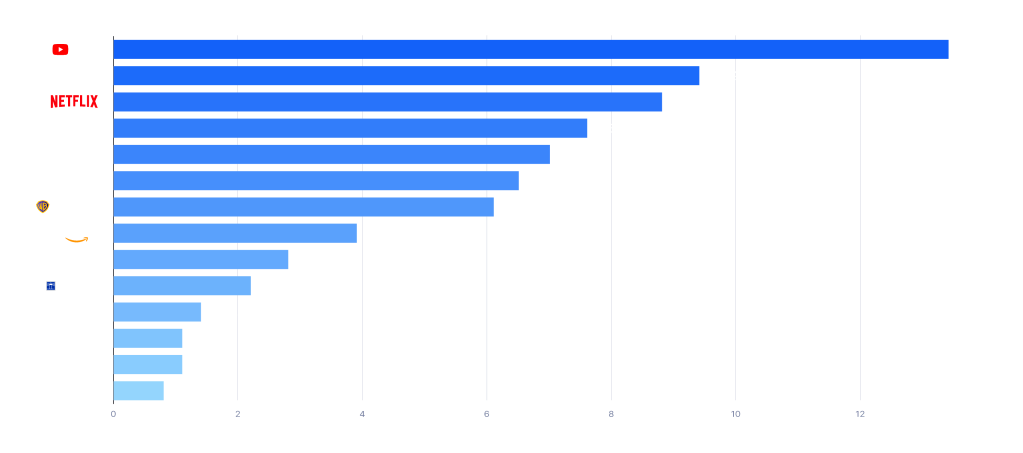
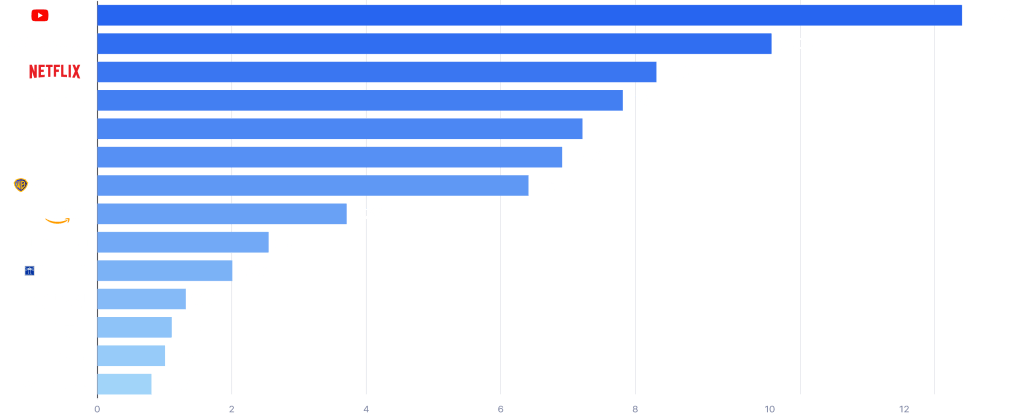
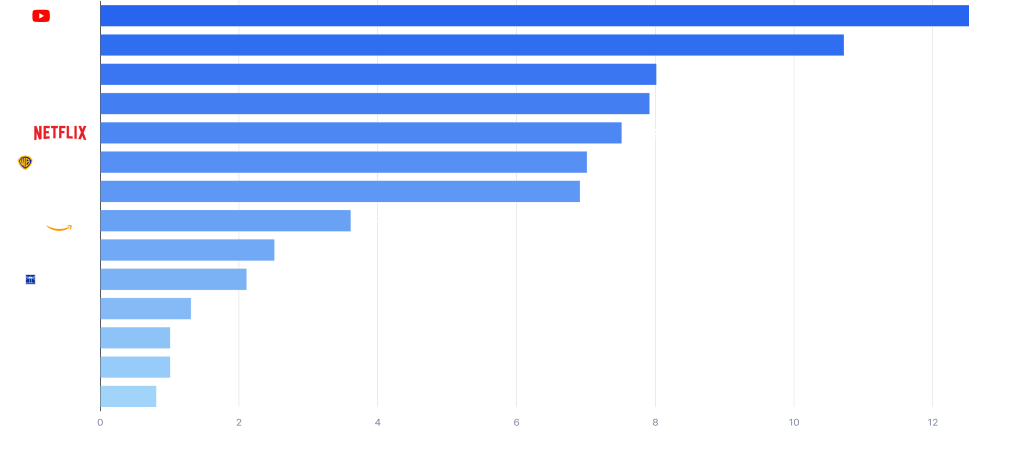
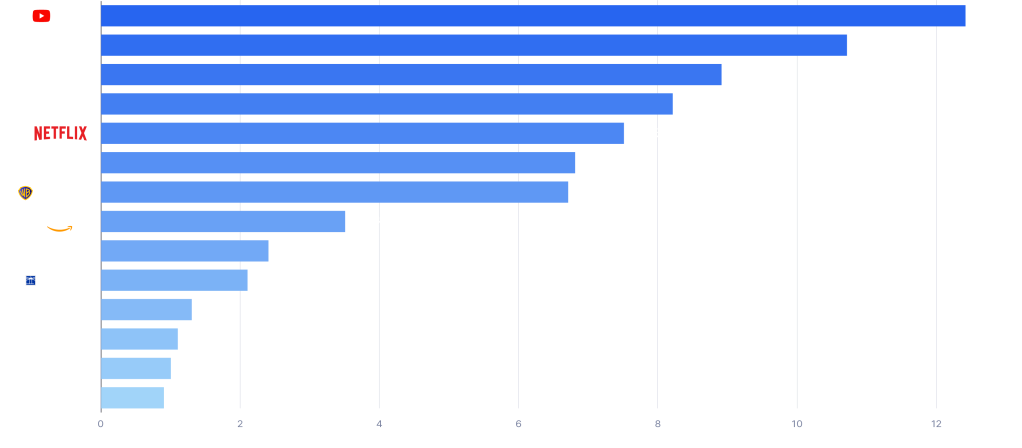
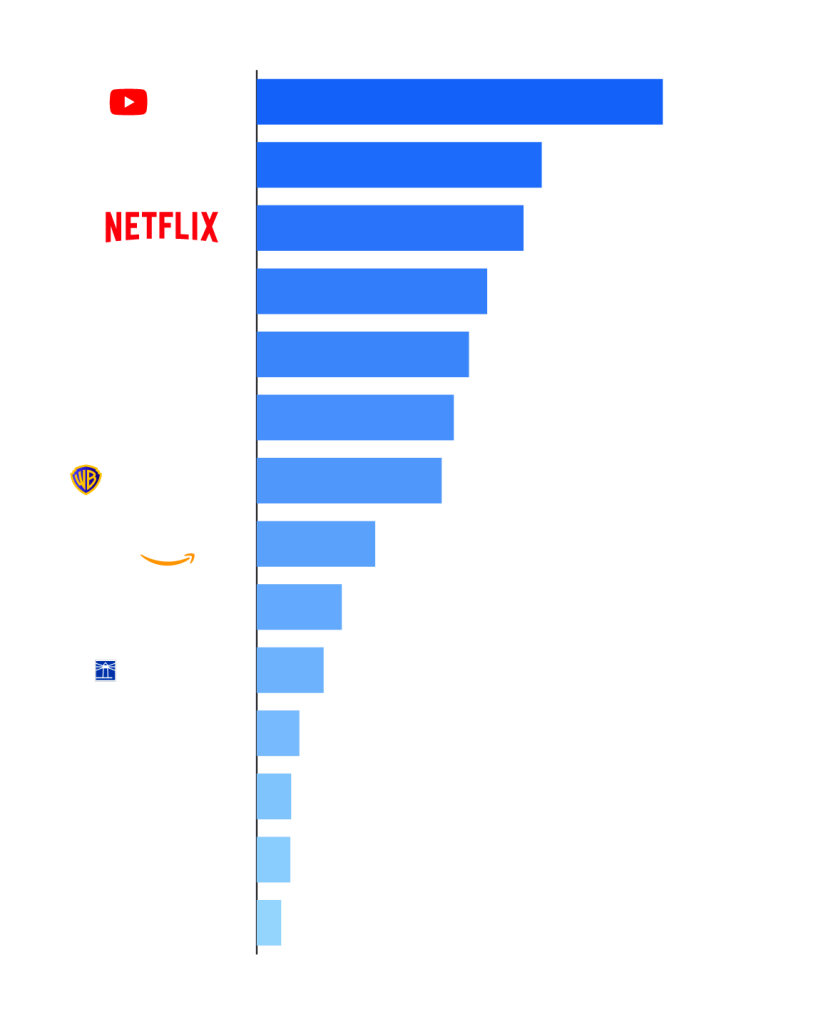
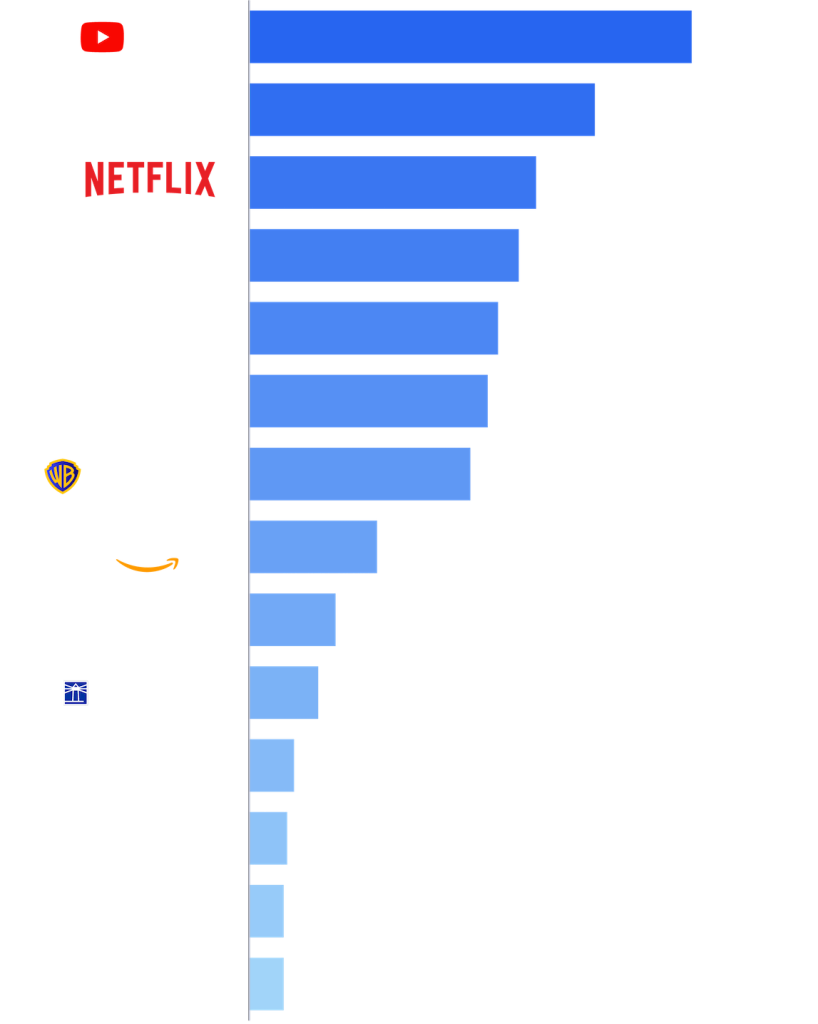
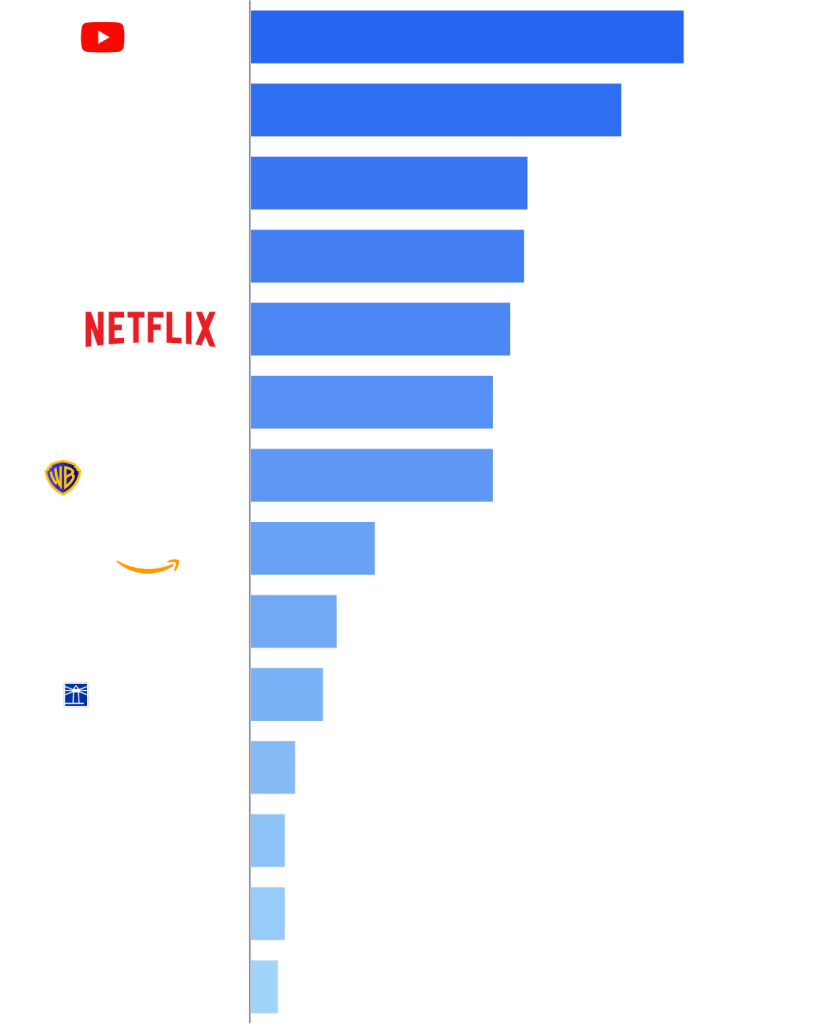
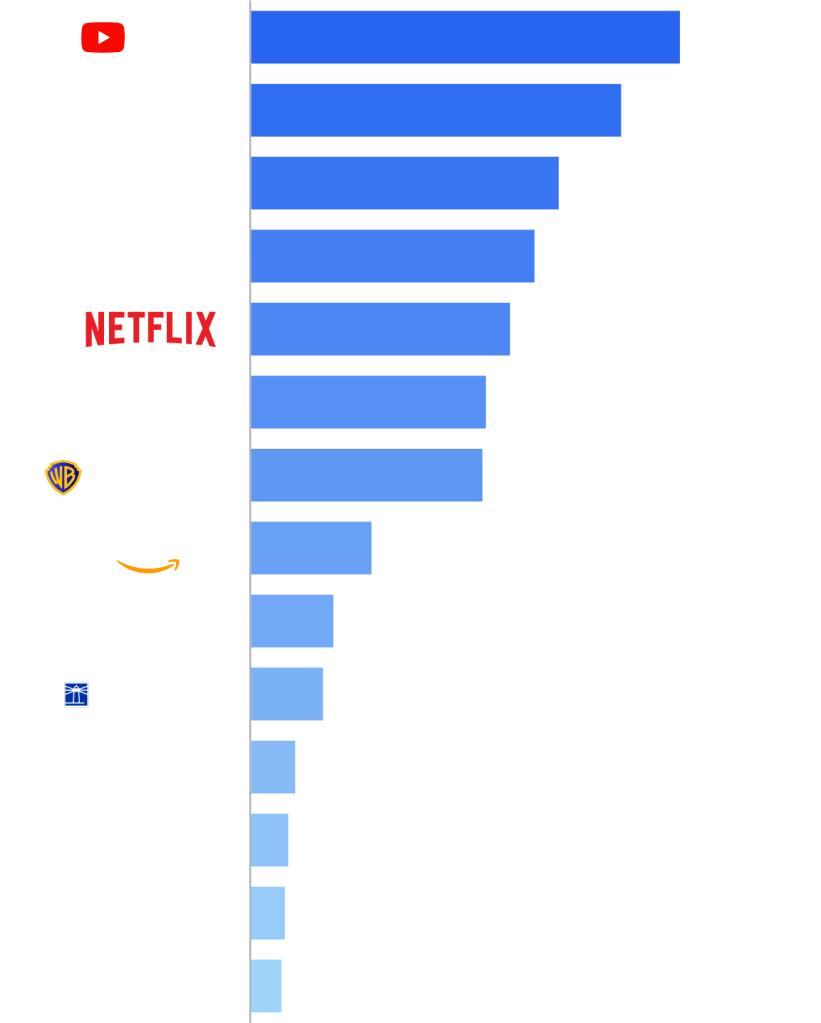
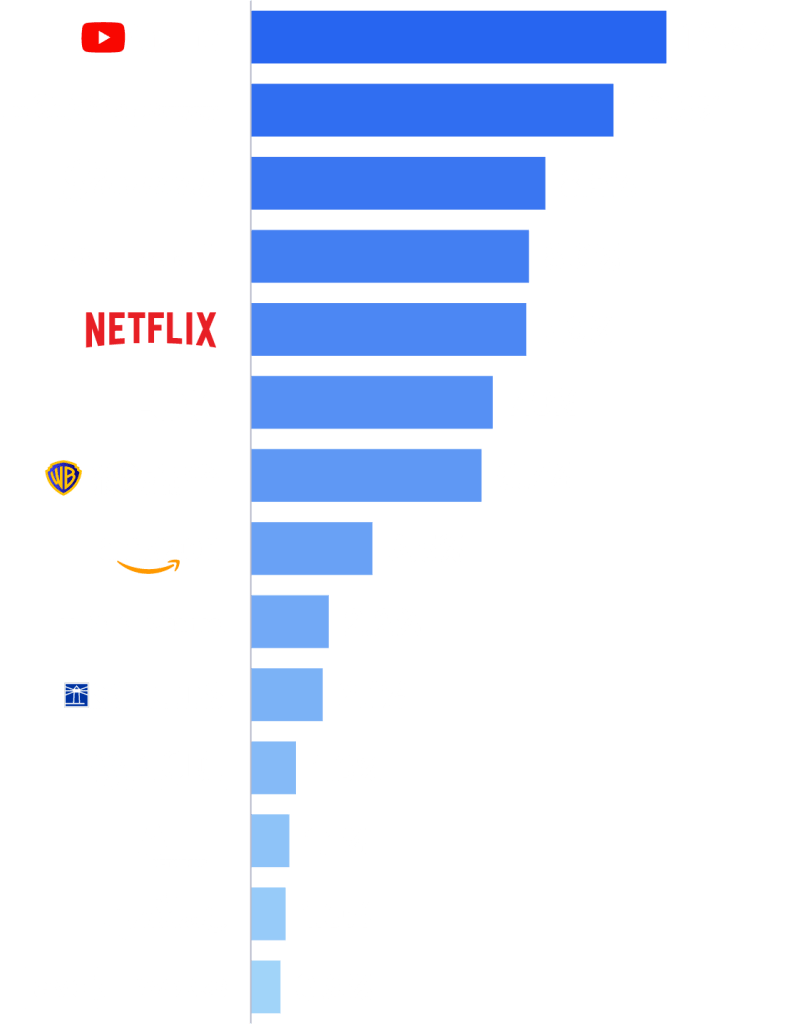
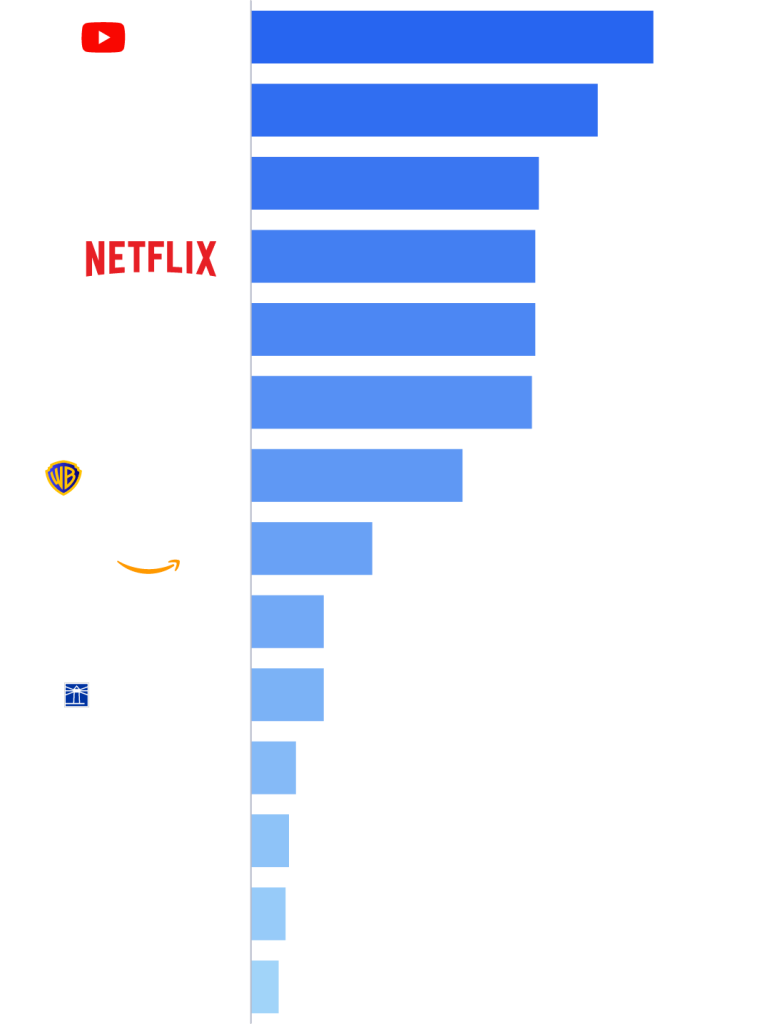
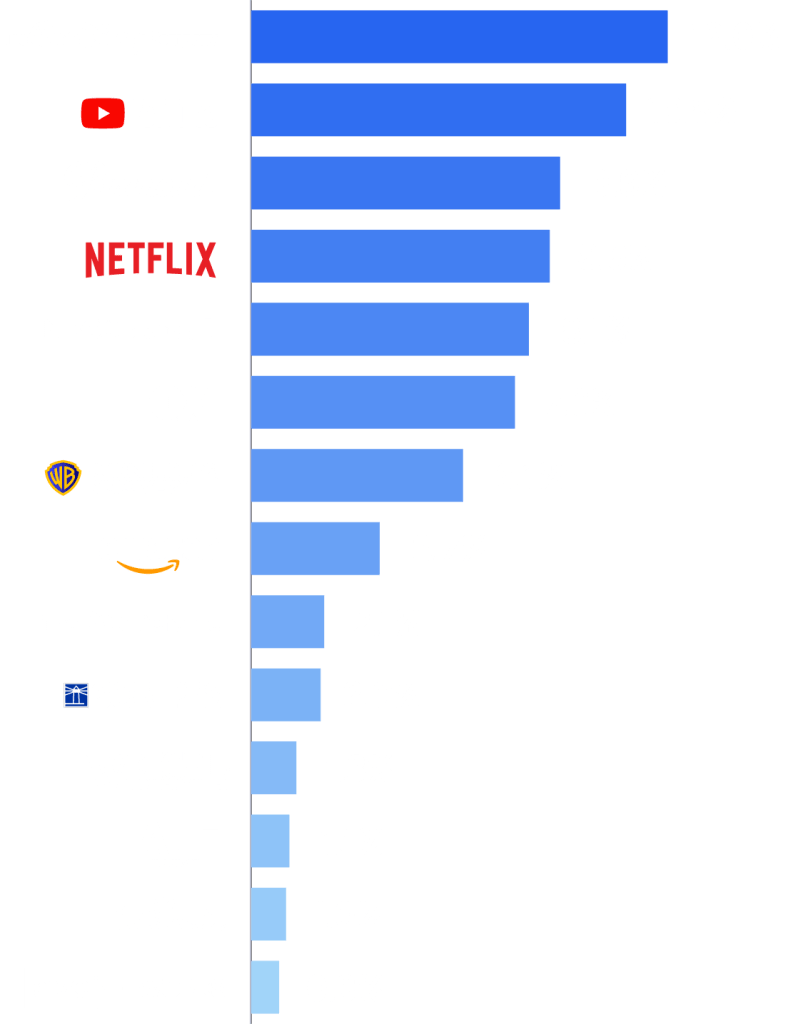
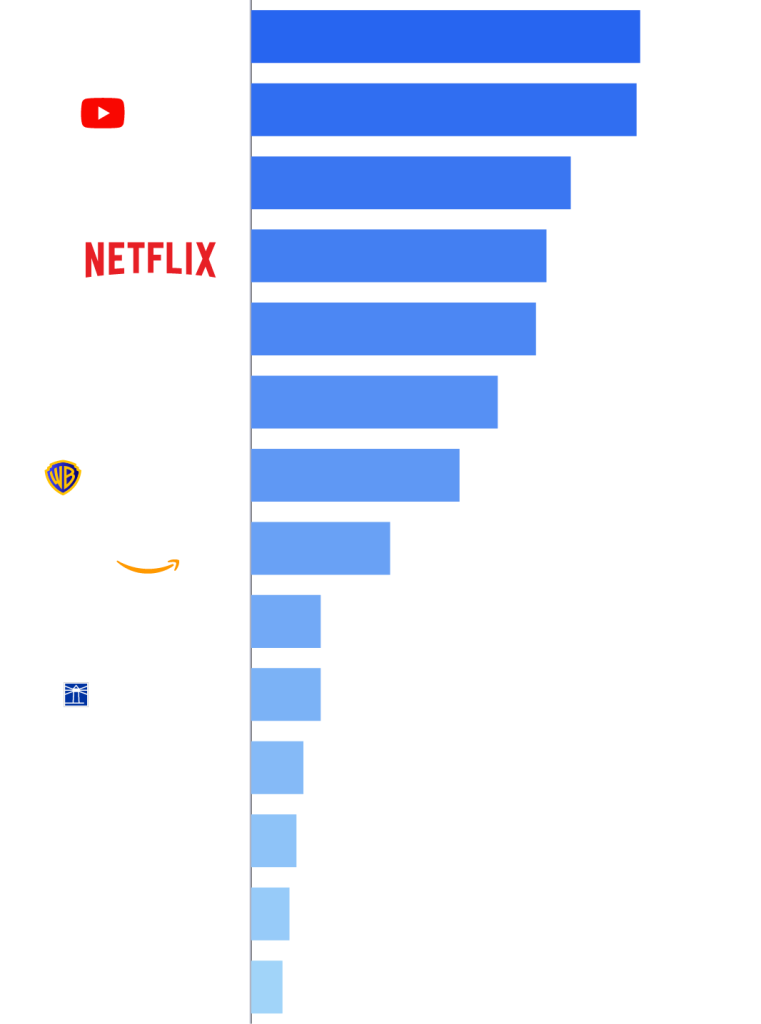
NEW YORK - 22 grudnia 2025 r. – Nielsen’s November 2025 Media Distributor Gauge revealed a complex television landscape defined by live sports, strategic streaming releases and the Thanksgiving holiday. Paramount and Netflix each clocked double-digit growth over October, capitalizing on strong content slates and disrupting the Media Distributor rankings this month.
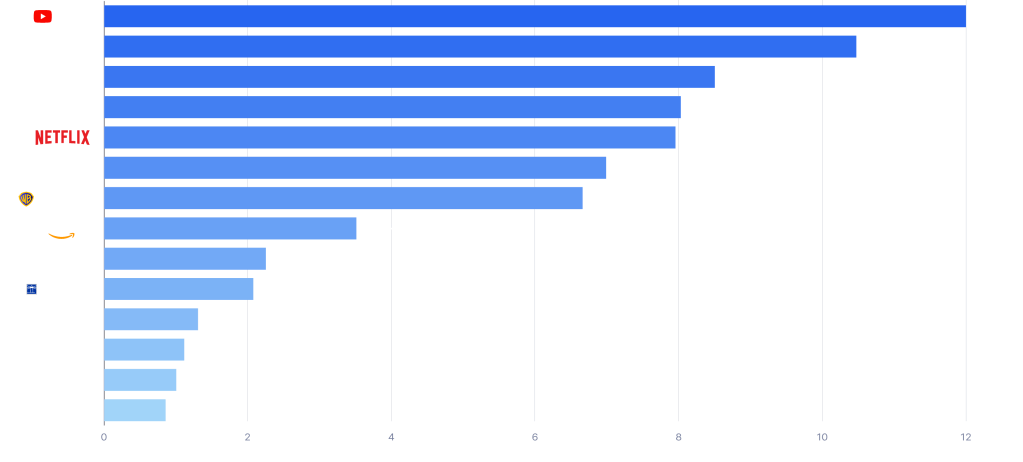
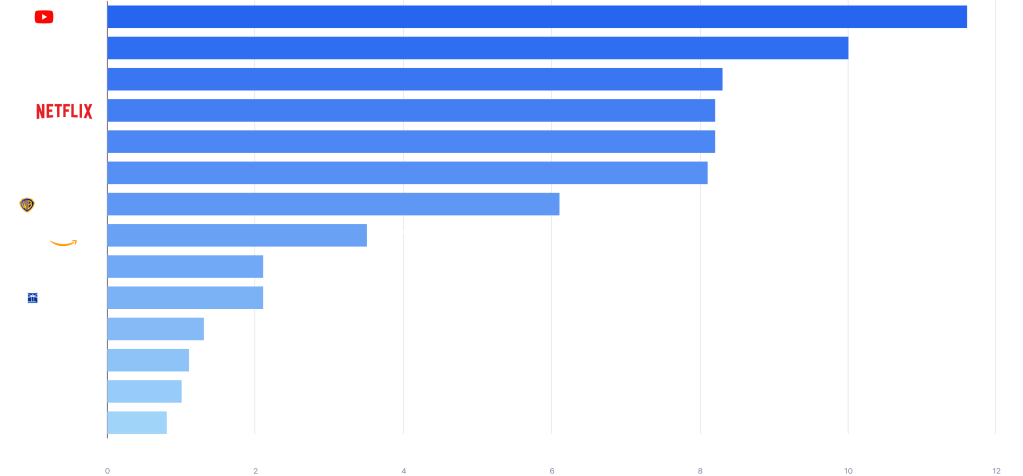
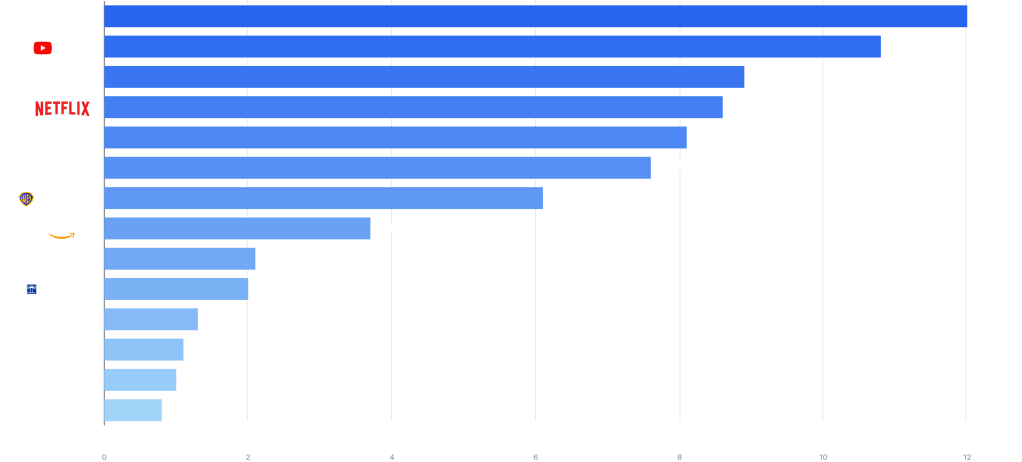
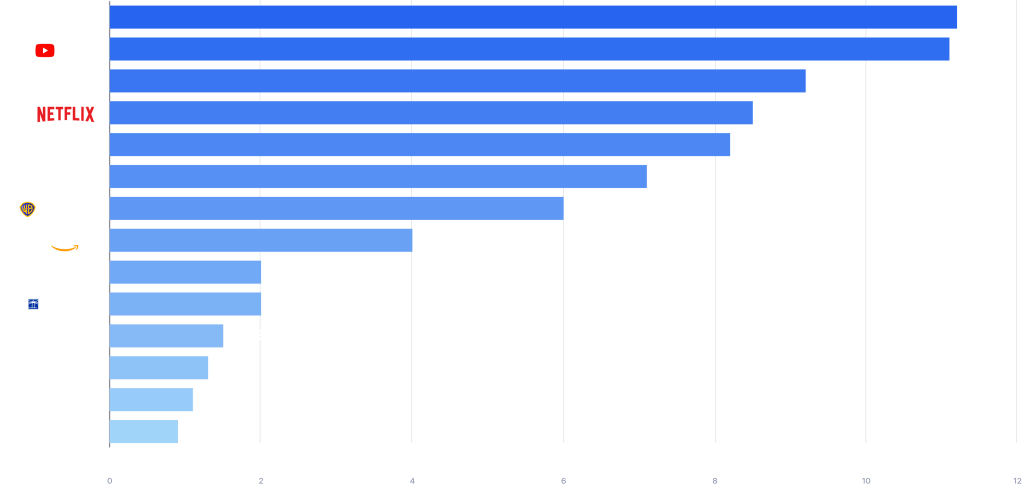
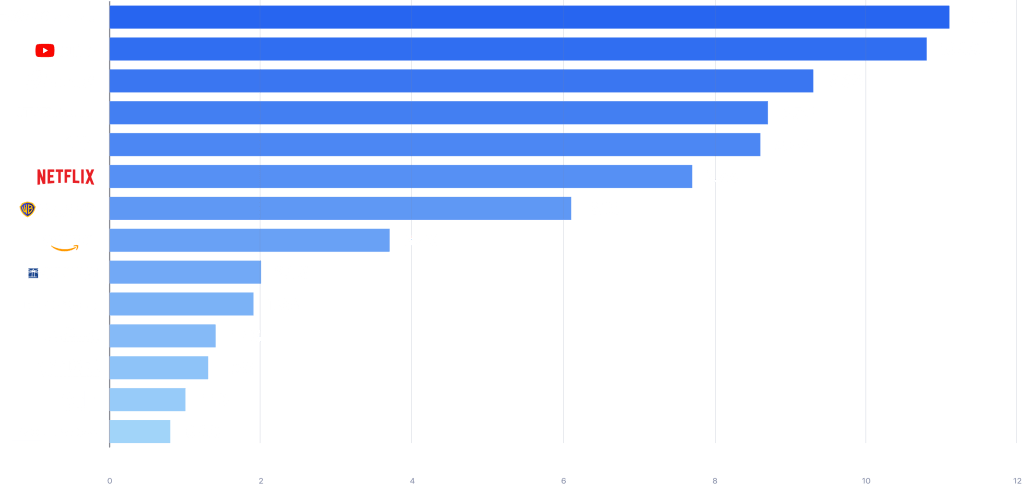
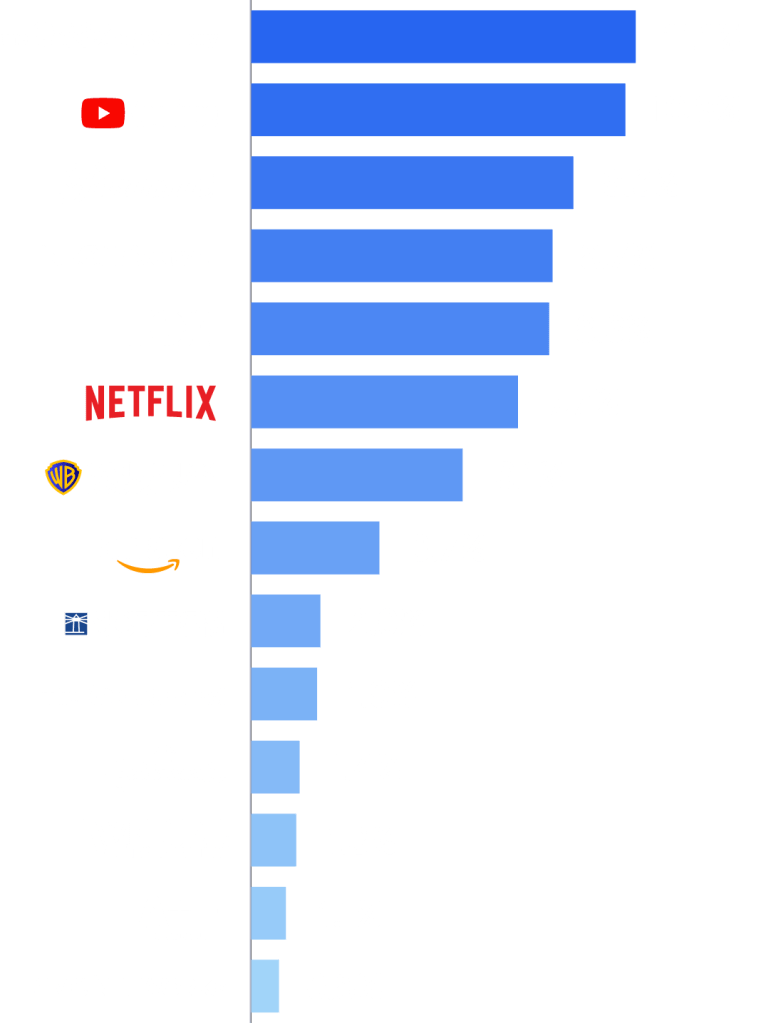
W listopadzie Paramount odnotował 14-procentowy wzrost oglądalności i zakończył miesiąc z największym udziałem w rynku telewizyjnym od kwietnia, zdobywając 8,9% całkowitego czasu oglądania i awansując na trzecie miejsce w rankingu Media Distributor Gauge. Wzrost Paramount o 0,7 punktu procentowego był największy spośród wszystkich dystrybutorów i wynikał w równym stopniu z jego działalności telewizyjnej i streamingowej. Stacje afiliowane CBS i Paramount+ odnotowały wzrost o ponad 18%, przyczyniając się odpowiednio do 0,5 i 0,2 punktu udziału w całkowitym wyniku Paramount.
Netflix also delivered a robust performance in November, notching this month’s second-highest viewing gain (up 10%) to add 0.3 share points and achieve 8.3% of TV. While the return of Netflix’s iconic series Stranger Things provided the largest viewing impact with nearly 12 billion viewing minutes on its own, the streamer also benefited from its depth of content. Netflix’s new original series Bestia we mnie, and new Frankenstein film reimagined by Guillermo del Toro, combined for nearly 7 billion viewing minutes across the month.
Hallmark produced a 28% viewing gain in November and set the mark for the highest percentage viewing increase this month. Hallmark benefited from its signature slate of holiday movies and its original series, Mistletoe Murders, all of which led to 0.2 additional share points for 1.2% of total TV watch-time.
Pomimo zmian poniżej nich, YouTube i Disney utrzymały dwie pierwsze pozycje w rankingu, z udziałem odpowiednio 12,9% i 10,5% rynku telewizyjnego. Udział YouTube w rynku telewizyjnym pozostał niezmieniony w ujęciu miesięcznym. Disney stracił 0,9 punktu procentowego, głównie z powodu spadków stacji afiliowanych ABC i ESPN, które można przypisać przerwom w nadawaniu spowodowanym sporem z YouTube TV.
NBCUniversal (NBCU) posted a strong month with a 7% increase in overall viewing, capturing its largest total since October 2024 with 8.8% of TV viewing (+0.2 pts.). NBCU’s gains were driven by a 22% surge in streaming on Peacock, largely fueled by NFL Sunday Night Football coverage, Thanksgiving Day programming, and its new original drama series To wszystko jej wina. Peacock achieved a non-Olympic monthly record 1.9% share of television in November, as reported in Nielsen’s The Gauge.
W listopadzie FOX odnotował miesiąc nieproporcjonalnych wahań w swoich nadawanych programach telewizyjnych i kablowych. Stacje afiliowane FOX odnotowały wzrost o 22% w porównaniu z październikiem, głównie dzięki meczowi NFL pomiędzy Green Bay i Detroit w Święto Dziękczynienia oraz meczom 4-7 World Series, gdzie finałowy mecz uplasował się na szóstym miejscu wśród najczęściej oglądanych programów telewizyjnych miesiąca. W przypadku kanałów kablowych oglądalność Fox News Channel spadła o 9% w porównaniu z poprzednim miesiącem, a FS1 odczuło brak rozgrywek MLB Postseason. Ogólnie rzecz biorąc, FOX zakończył miesiąc z wynikiem netto 2,4%, ale ze względu na większy wzrost ogólnego wykorzystania telewizji (+5,5%) stracił 0,3 punktu udziału w rynku, kończąc listopad z wynikiem 8,1%.
Okres listopadowy 2025 r. obejmował pięć tygodni, od 27 października 2025 r. do 30 listopada 2025 r. Raporty Nielsen są sporządzane zgodnie z kalendarzem emisji, a tygodniowe okresy rozpoczynają się w poniedziałek.


Informacje o The Gauge™
The Gauge™ is Nielsen’s monthly snapshot of total broadcast, cable and streaming consumption that occurs through a television screen, providing the industry with a holistic look at what audiences are watching. The Gauge was expanded in April 2024 to include Wskaźnik dystrybutora mediów, which reflects total viewing by media distributor across these categories. Read more about The Gauge methodology and FAQs.
O firmie Nielsen
Nielsen is a global leader in audience measurement, data and analytics. Through our understanding of people and their behaviors across all channels and platforms, we empower our clients with independent and actionable intelligence so they can connect and engage with their global audiences—now and into the future. Learn more at www.nielsen.com and connect with us on social media (X, LinkedIn, YouTube, Facebook oraz Instagram).
Press Contact
Lauren Pabst
