TV has changed dramatically in recent years. New devices, distributors, streaming platforms, subscription models, and formats are transforming the industry and empowering viewers. But there’s one thing that hasn’t changed: People love to watch TV together.
It depends on the occasion, of course—what the program is, the time of day, the size of the screen, what room it’s in, the size of the family and whether anyone simply happens to be around. But people get together today to watch the 슈퍼볼 or The Bachelorette for the same reason they got together to watch M*A*S*H or the Apollo 11 moon landing half a century ago: to have someone to share the experience with.
In the lingo of the media industry, that’s known as co-viewing. Let’s examine why it’s so important for measurement companies to get it right.
사람들은 얼마나 자주 TV를 함께 시청하나요?
닐슨은 오랫동안 공동 시청에 대해 연구해 왔습니다. 닐슨의 역사적인 측정 솔루션은 소수의 주요 방송 네트워크만 존재하던 시절에도 항상 사람을 기반으로 했습니다. 따라서 공동 시청 규모를 측정할 수 있는 신뢰할 수 있는 데이터 소스를 항상 확보하고 있었습니다. 오늘날 미국 전역의 가정에서 선형 및 커넥티드 TV(CTV)의 47%1가 한 번에 두 명 이상이 시청하고 있습니다.
Today, there’s virtually no difference in co-viewing rates between linear TV and CTV, but it wasn’t always the case. Back in 2017, we ran a study with Roku and found a significant gap in co-viewing between linear TV (48%) and OTT (34%). Since then, smart TVs have become more widespread and large screens more affordable. And, increasingly, consumers don’t make the distinctions between linear and streaming or TV and digital. It’s all TV.
But that doesn’t mean that there aren’t any variations and that the same co-viewing factor can be applied across the board. There’s more co-viewing during primetime and on weekends, for sports and children programming, among men, young adults and in houses with more children. It also matters where the TV is located inside the house. Every case is different, and the only way to properly account for co-viewing is to measure it directly or model it separately for every ad impression.
사람들이 함께 TV를 시청하는지 여부에 신경 쓸 이유가 있나요?
Most brands want to reach people, not households—and certainly not faceless devices. Wholesale ad impressions are nice, but they’re not enough. When they buy media, advertisers and their agencies spend top dollars to reach specific demographic targets (like 18-34 year-old women in Philadelphia, or 55+ in Arizona) or advanced audiences (like EV drivers who buy organic). They need guarantees that their ads are reaching the right people, and measuring co-viewing gets to the heart of that question.
미디어 기업은 시청자를 파악하고 프로그램을 최적화하며 광고 인벤토리에 적절한 가격을 책정하기 위해 누가 자사 콘텐츠를 시청하는지 알아야 합니다. 예를 들어, 새 프로그램이 특히 젊은 성인층에게 좋은 반응을 얻는다면 새 시즌을 주문하고, 유사한 프로그램을 승인하고, 틈새 팔로워를 개발하여 수익을 창출하여 구독자를 늘리거나 해당 시청자에게 도달하고자 하는 광고주를 유치할 수 있습니다.
오늘날의 고도로 세분화되고 경쟁이 치열한 TV 환경에서 미디어 기업은 더 이상 '톤수'를 팔지 않으며, 광고주는 무분별한 '아이볼'을 구매하지 않습니다. 이들 모두는 시청자 중복 제거(기기 내 및 기기 간), 온타겟 광고 게재 계산, 도달 범위 및 빈도 최적화, 주요 캠페인 성과 지표(예: 타겟 데모 효율률) 개선에 도움이 되는 측정 솔루션이 필요합니다. 개인 수준 측정 없이는 이러한 목표를 달성할 수 없습니다.
닐슨에서 공동 시청을 어떻게 측정하나요?
The most direct way to measure co-viewing is to monitor TV viewership at the individual level. That’s the case with our National TV Panel and top Local TV Markets. In these markets, our panelists “check-in” to the audience. But to add more depth and stability to our audience solutions—and provide more visibility into smaller audiences in smaller TV markets—we’re increasingly relying on big data based on ACR (for smart TVs) return-path data (for cable and satellite providers), or device and context identifiers (for ad impressions). And those technologies only capture viewing information at the household level.
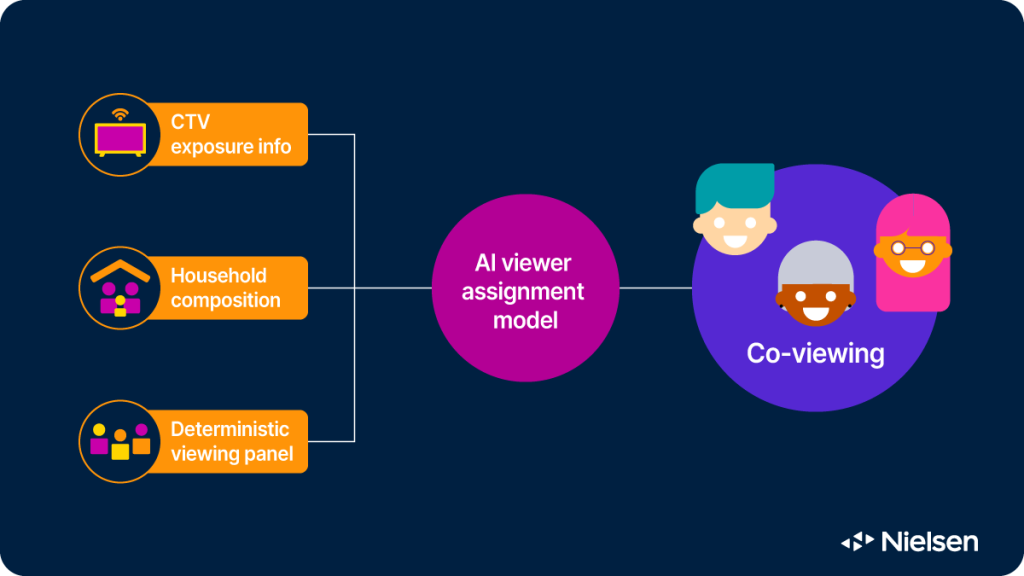
Nielsen is able to determine who is watching thanks to a process called Viewer Assignment that was developed a decade ago and has since been continuously refined. It uses advanced statistical techniques to match faceless viewing data from big data sources (like Roku, Vizio, Hulu, Netflix, 유튜브 and others) to our persons-level panel data for every possible viewing event and ad impression. The match is based on similarities in viewing behavior (down to the program level) as well as geography, household composition, device type and location inside the house, time of day, day of week, and other key predictors. The model never stops learning, and we’re constantly validating its performance to make sure it’s as close to reality as possible.
패널 데이터를 확보하면 새로운 데이터 소스를 최대한 활용하는 데 큰 도움이 되지만, 시청자 할당과 같은 프로세스가 시청자 데이터가 누락되는 모든 경우를 보완하지는 않는다는 점을 인식하는 것이 중요합니다. 때로는 시청 데이터와 신뢰할 수 있는 일치하는 정보가 없거나 가구 구성을 쉽게 구할 수 없는 경우도 있습니다. 전체 TV 데이터의 약 9%는 연령과 성별과 같은 간단한 시청자 인구 통계조차도 할당하기 어렵습니다. 이러한 경우, 닐슨은 강력한 예측 모델을 사용하여 시청자 할당 정보를 제공하고 전달합니다.
다음 단계는 무엇인가요?
최근의 방법론적 혁신을 통해 더 많은 광고 게재 위치에 시청자 특성을 할당할 수 있게 되었으며, 그 과정에서 도달 범위를 측정하는 능력이 크게 향상되었습니다. 닐슨의 방대한 데이터와 시그널을 통해 지속적으로 학습하는 모델을 통해 시청자 예측을 더욱 포괄적으로 개선할 수 있습니다.
공동 시청은 항상 TV 시청 경험의 필수적인 부분이었으며, 이는 앞으로도 변하지 않을 것입니다. 측정 전략에서도 공동 시청이 필수적인 부분인지 확인하세요.
Nielsen’s Need to Know reviews the fundamentals of audience measurement and demystifies the media industry’s hottest topics. Read every article here.
참고
1Nielsen Panel Data


