テレビはいつの時代も、友人や家族が集まってエンターテインメントを楽しみ、互いの交流を深める、家庭内の磁石のような存在だった。それは今日でも変わらないが、物理的なテレビは、従来の番組を見るための窓以上の存在になっている。生放送の予定されたテレビ視聴は、依然として私たちのメディア食生活に定着しているが、ストリーミングは今年末までに、米国における消費者の総テレビ視聴時間の3分の1を占める勢いである。
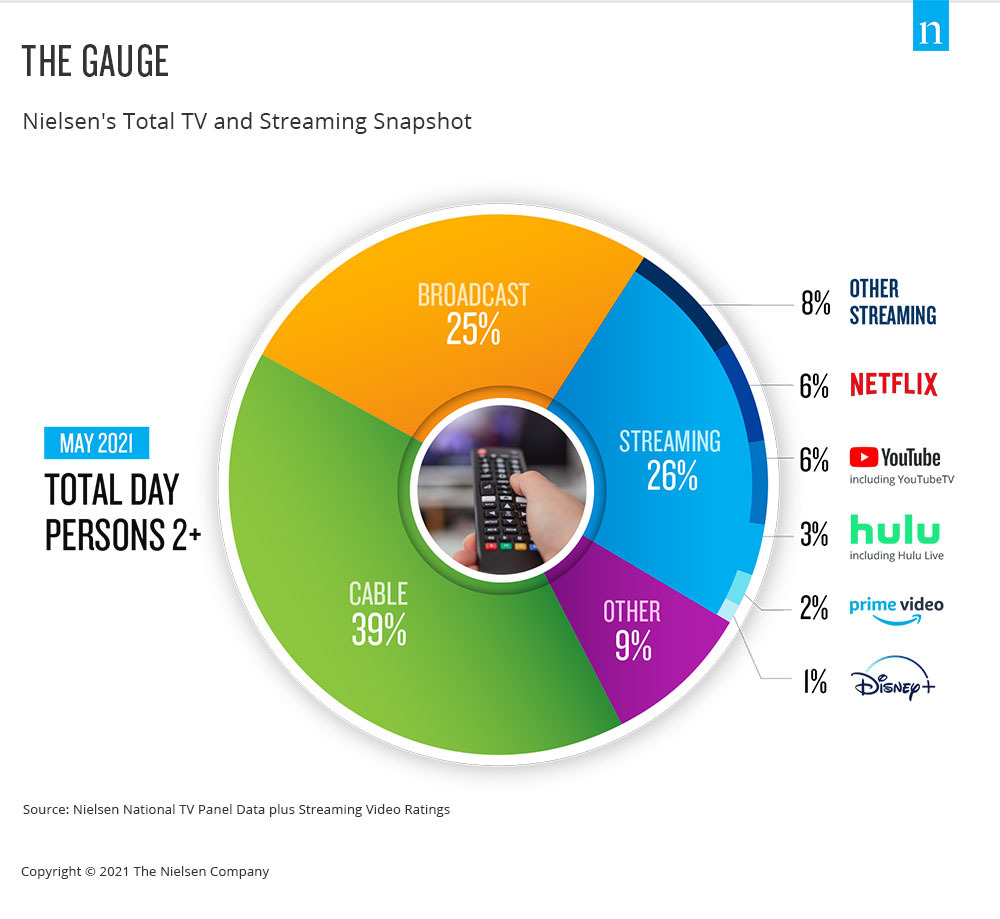
Few areas of the media landscape have been in focus over the past year as streaming video content has, and the TV set is a key portal for that engagement. There is no shortage of news and hype about the streaming landscape, as well as how streaming engagement has dramatically altered video viewing, as it now accounts for 26% of total TV usage. While that statistic is telling on its own, it doesn’t contextualize streaming usage within the broader usage of TV.
From a media industry perspective, nothing is more valuable than accurate, comparable data. And as audiences no longer see a difference between traditional TV, streaming and digital, measurement shouldn’t either. That’s where the Gauge, Nielsen’s total TV and streaming snapshot, comes in. This important step forward in the journey toward true cross-platform measurement and Nielsen ONE simplifies TV usage, illustrating television consumption behavior in a single graphic. With this view, to be updated monthly, industry participants will be able to see critical behavioral shifts and consumer trends with respect to total TV viewing. Additionally, the Gauge tracks “other” use of the TV, such as via game consoles, to give an accurate view of what people are doing in their dens and living rooms.
Importantly, the Gauge does more than simply chart streaming behavior within U.S. homes that have the ability to stream. The snapshot represents streaming across すべて television homes, which means that the share of streaming more accurately represents consumer behavior in a way that’s easy to describe and understand. The new representation also shows select streaming distributor shares against the total television universe so it provides better comparability within television usage.
スタジオ、ネットワーク、広告主、代理店、業界団体が、消費者が関与する様々なビデオコンテンツについて明確化を求める中で、ストリーミング消費の成長を追跡し、他のテレビ利用とともにそれを見ることは極めて重要である。
ニールセンの視聴者測定へのアプローチは、地理的に代表的な実在の人々のパネルとビッグデータを活用し、メディア消費の未来のために構築されています。そしてthe Gauge使えば、テレビ消費の未来が一望できる。
For more information visit ゲージ.
方法論
- ケーブルセットトップボックス経由のストリーミングは、各ストリーミング配信事業者にクレジットされず、「その他すべて」のグループに含まれる。
- Data used is derived from two separately weighted panels and combined to create the infographic. Streaming data comes from a subset of TV households in the national TV panel that are enabled with the streaming meter, while linear sources as well as total usage are based on viewing from the overall TV panel.
- エンコードされたリニアストリーミングは、リニア(放送、ケーブル)グループと、それぞれのリニアストリーミングアプリ(例:Hulu Live、YouTube TV、その他のストリーミングMVPD/vMVPDアプリ)の下に反映される。
