Auckland, March 11, 2025 – Nielsen Ad Intel, New Zealand’s most comprehensive ad spend monitoring service, today released its 2024 Advertising Spend Report, revealing the top advertisers, highest-investing industries, and key market shifts over the past year.
I settori del commercio al dettaglio, dell'alimentazione e delle telecomunicazioni sono rimasti dominanti, mentre i settori farmaceutico e assicurativo hanno registrato guadagni significativi grazie all'adattamento dei marchi ai cambiamenti dei comportamenti dei consumatori e alle tendenze del settore.
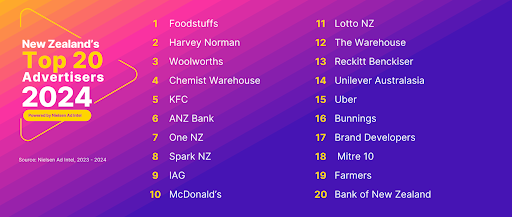
I 20 principali inserzionisti della NZ per il 2024
1. Foodstuffs, 2. Harvey Norman, 3. Woolworths, 4. Chemist Warehouse, 5. KFC, 6. ANZ Bank, 7. One NZ, 8. Spark NZ, 9. IAG, 10. McDonald's, 11. Lotto NZ, 12. The Warehouse, 13. Reckitt Benckiser, 14. Unilever Australasia, 15. Uber, 16. Bunnings, 17. Sviluppatori di marchi, 18. Mitre 10, 19. Agricoltori, 20. Banca della Nuova Zelanda
Monique Perry, Nielsen Pacific MD said: “The Ad Intel spend data for 2024 tells a clear story – businesses aren’t just maintaining their advertising spend, they’re increasing it! Advertising remains the most effective way to forge strong connections between brands and consumers. Nielsen’s insights have become indispensable for advertisers and agencies looking to stay ahead of the curve”.
Nielsen Ad Intel’s Pacific Commercial Lead, Rose Lopreiato, added: “Retail remains the leader in ad spend, but we’re seeing pharmaceuticals and insurance brands making major strides. With an increasingly dynamic market, these insights are crucial for advertisers refining their strategies and allocating budgets effectively. Nielsen Ad Intel continues to set the industry standard for tracking advertising trends, delivering the clearest and most actionable insights into New Zealand’s evolving media landscape.”
Categorie pubblicitarie con i maggiori investimenti nel 2024
Nonostante le pressioni economiche, gli inserzionisti neozelandesi hanno stanziato budget consistenti in vari settori. I leader sono stati:
1. Fast food, restaurants & cafes – $293 million, 2. Supermarkets – $194 million, 3. Banks – $180 million, 4. Department stores – $153 million, and 5. Homes & properties – $138 million.

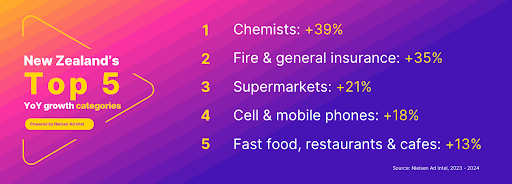
Le 5 principali categorie con la maggiore crescita annuale
Gli investimenti pubblicitari hanno registrato una crescita significativa in diversi settori tra il 2023 e il 2024, con il settore farmaceutico e assicurativo in testa:
1. Chemists (+39%), 2. Fire & general insurance (+35%), 3. Supermarkets (+21%), 4. Cell & mobile phones (+18%), and 5. Fast food, restaurants & cafes (+13%).
Informazioni su Nielsen
Nielsen is a global leader in audience measurement, data and analytics. Through our understanding of people and their behaviours across all channels and platforms, we empower our clients with independent and actionable intelligence so they can connect and engage with their global audiences – now and into the future. Learn more at www.nielsen.com and connect with us on social media (X, LinkedIn, YouTube, Facebook and Instagram).
About Nielsen Ad Intel
Ad Intel provides the most complete source of cross-platform advertising intelligence available today. With intuitive software, review-and-compare ad activity across media, company, category or brand, plus historical data.
Nota: Nielsen monitora la spesa pubblicitaria lorda sui principali media in base ai valori del tariffario pubblicato. Sebbene alcuni proprietari di media offrano sconti, le tariffe non sono disponibili pubblicamente. Si noti inoltre che i dati relativi alle categorie e ai raggruppamenti di marche/prodotti sono raggruppati a discrezione di Nielsen.
Press Contact
Dan Chapman
dan.chapman@nielsen.com
+61 4040884
