Il televisore è sempre stato un magnete all'interno della casa che riunisce amici e familiari per godere dell'intrattenimento e della compagnia reciproca. Questo è vero anche oggi, ma il televisore fisico è diventato molto più di una finestra sulla programmazione tradizionale. La visione della TV in diretta e programmata rimane un punto fermo nella nostra dieta mediatica, ma lo streaming è destinato a rappresentare un terzo del tempo televisivo totale dei consumatori negli Stati Uniti entro la fine di quest'anno.
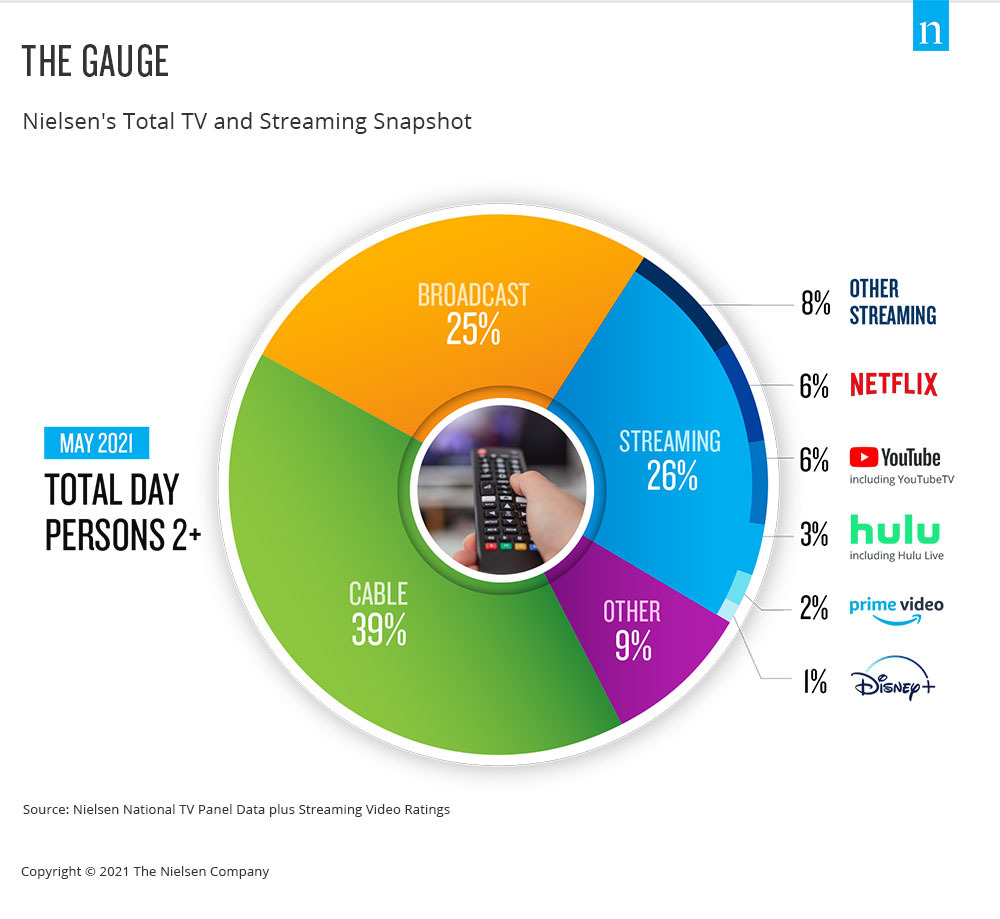
Few areas of the media landscape have been in focus over the past year as streaming video content has, and the TV set is a key portal for that engagement. There is no shortage of news and hype about the streaming landscape, as well as how streaming engagement has dramatically altered video viewing, as it now accounts for 26% of total TV usage. While that statistic is telling on its own, it doesn’t contextualize streaming usage within the broader usage of TV.
From a media industry perspective, nothing is more valuable than accurate, comparable data. And as audiences no longer see a difference between traditional TV, streaming and digital, measurement shouldn’t either. That’s where the Gauge, Nielsen’s total TV and streaming snapshot, comes in. This important step forward in the journey toward true cross-platform measurement and Nielsen ONE simplifies TV usage, illustrating television consumption behavior in a single graphic. With this view, to be updated monthly, industry participants will be able to see critical behavioral shifts and consumer trends with respect to total TV viewing. Additionally, the Gauge tracks “other” use of the TV, such as via game consoles, to give an accurate view of what people are doing in their dens and living rooms.
Importantly, the Gauge does more than simply chart streaming behavior within U.S. homes that have the ability to stream. The snapshot represents streaming across all television homes, which means that the share of streaming more accurately represents consumer behavior in a way that’s easy to describe and understand. The new representation also shows select streaming distributor shares against the total television universe so it provides better comparability within television usage.
Tracciare la crescita del consumo di streaming - e considerarlo insieme ad altri usi televisivi - è fondamentale in quanto gli studios, le reti, gli inserzionisti, le agenzie e i gruppi industriali cercano di fare chiarezza sui vari contenuti video con cui i consumatori si confrontano.
L'approccio di Nielsen alla misurazione dell'audience, che si avvale di un panel geograficamente rappresentativo di persone reali e di big data, è costruito per il futuro del consumo dei media. E con il the Gauge, il futuro del consumo televisivo è visibile in un'unica visione.
For more information visit The Gauge.
Metodologia
- Streaming via cable set top boxes does not credit to the respective streaming distributors, but instead is included in the “all other” group.
- Data used is derived from two separately weighted panels and combined to create the infographic. Streaming data comes from a subset of TV households in the national TV panel that are enabled with the streaming meter, while linear sources as well as total usage are based on viewing from the overall TV panel.
- Lo streaming lineare codificato si riflette sia nel gruppo lineare (broadcast, via cavo) sia nella rispettiva app di streaming lineare (ad esempio, Hulu Live, YouTube TV, altre app di streaming MVPD/vMVPD).
