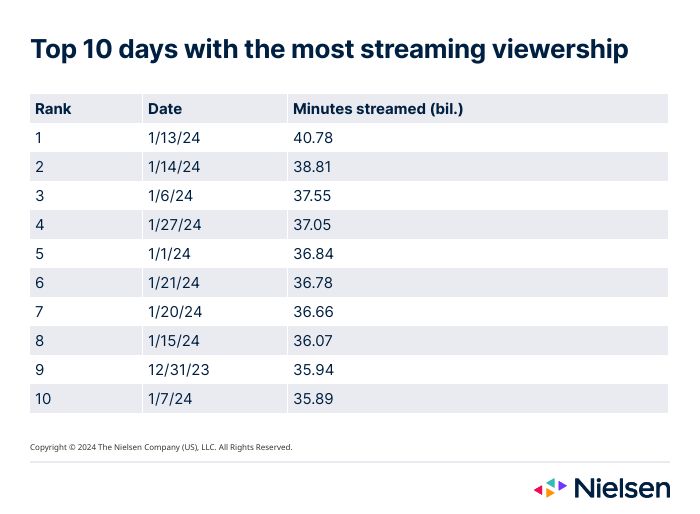
Il 13 gennaio 2024 il pubblico trasmetterà in streaming la cifra record di 40,8 miliardi di minuti di visione.
Chilly weather, coupled with the excitement of the NFL playoffs, helped boost total TV viewership 3.7% in January. While historically characteristic for the month, the uptick was perhaps more noteworthy because it was 1.4% above its level last year—a reporting period that was longer and wasn’t in short supply of new programming. In fact, January 2024 included three of the top 10 days with the most TV viewing since Nielsen began producing The Gauge in May 2021.
Mentre il football è sempre un fattore determinante per gli ascolti televisivi, il clima più freddo del solito ha giocato un ruolo importante negli ascolti televisivi in mercati che non sono così freschi come la stagione, come Tulsa e Portland, dove gli ascolti televisivi sono aumentati rispettivamente del 10% e del 7%. A Tampa, le temperature più fresche e la corsa ai playoff dei Buccaneers hanno contribuito ad aumentare gli ascolti televisivi del 14% rispetto all'anno precedente.
La potenza dei playoff della NFL si è estesa anche al panorama dello streaming: la partita di Wildcard tra i Miami Dolphins e i Kansas City Chiefs su Peacock ha generato quasi 3,9 miliardi di minuti di visione (compresa la visione locale a Kansas City e Miami) e ha contribuito a far sì che il 13 gennaio 2024 si aggiudicasse la corona del più grande volume giornaliero di streaming mai registrato. In totale, il mese di gennaio 2024 comprende nove dei 10 giorni con il più alto volume di streaming mai registrato da Nielsen, con il Capodanno 2023 (che è stato registrato nell'intervallo di dicembre) che si è intrufolato al n. 9.
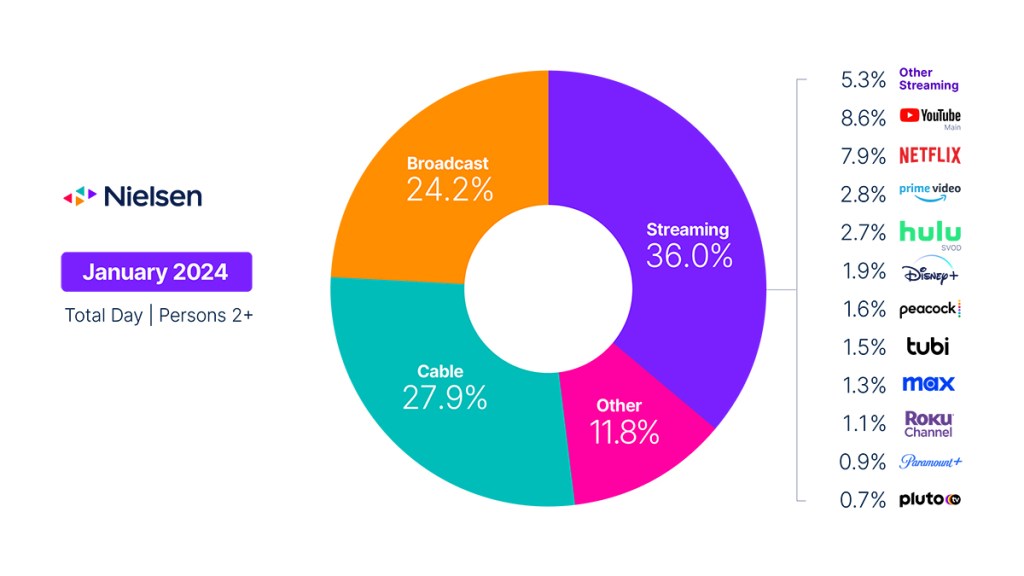
In addition to colder weather, January welcomed the beginnings of new, scheduled drama programming, which accounted for a 20% increase in viewing on broadcast networks. NBC’s Chicago franchise (Chicago Fire, Chicago Med, Chicago P.D.) led the way, representing some of the first “new” scripted content of the broadcast TV season. Combined with a 36% rise in sports viewing, broadcast was able to grow its share of TV by 0.7 share points to end the month at 24.2% of TV. With the arrival of new programming still somewhat limited, however, broadcast viewing was down 20% compared with a year ago.
La visione via cavo è aumentata del 2,7% a gennaio, ma l'aumento della fruizione televisiva totale ha comportato una perdita di 0,3 punti di share, attestandosi al 27,9% della televisione. La stagionalità ha giocato un ruolo importante, in quanto gli spettatori si sono allontanati dai film a tema natalizio, il che ha portato a un calo di oltre il 19% nella visione dei lungometraggi. In confronto, la visione delle notizie è aumentata, rappresentando il 19% dell'utilizzo complessivo della TV via cavo, con l'Iowa Town Hall su Fox News Channel che è diventato l'unico programma non sportivo ad entrare nella top 10 delle trasmissioni via cavo (escluse le telecronache sportive). Mentre la programmazione sportiva è stata meno diffusa via cavo, le partite di calcio hanno dominato i programmi più seguiti, tra cui la partita dei College Football Playoff tra Michigan e Alabama il giorno di Capodanno, che ha conquistato il primo posto con 26,1 milioni di spettatori.
Like broadcast, streaming also benefited from the return of new scripted programming, with Fool Me Once on Netflix topping the list of most-watched programs with 6.5 billion minutes—the first time an original has topped the streaming charts since Queen Charlotte – A Bridgerton Story did so in May 2023. Bluy, on Disney+, and Reacher, on Amazon Prime Video, were close behind, with 5.5 billion minutes and 4.3 billion minutes, respectively. In total, streaming usage was up 4.1% in January.
A livello di piattaforma, YouTube ha segnato il 12° mese consecutivo come primo servizio di streaming. Peacock ha registrato un'impennata del 29% nell'utilizzo, trainata dalla copertura dei playoff della NFL, raggiungendo una quota record dell'1,6% della TV. Netflix ha guadagnato 0,2 punti di share per chiudere il mese al 7,9% della TV, il massimo dall'agosto 2023, e l'aumento del 10% nell'utilizzo del canale Roku ha riportato la sua quota all'1,1% della TV totale.
Febbraio, oltre a includere gli spettatori del Super Bowl, segnerà l'inizio formale di una stagione televisiva abbreviata, che potrebbe compensare alcuni dei cali di audience che di solito seguono la fine della stagione NFL. Con la primavera non ancora alle porte, il continuo arrivo di nuovi contenuti sui canali tradizionali e in streaming terrà probabilmente impegnato il pubblico fino all'arrivo del caldo.
Tendenze dei dati di gennaio con Brian Fuhrer
The Gauge provides a monthly macroanalysis of audience viewing behaviors across key television delivery platforms, including broadcast, streaming, cable and other sources. It also includes a breakdown of the major, individual streaming distributors. The chart itself represents monthly total television usage, broken out into share of viewing by category and by individual streaming distributors.
Metodologia e domande frequenti
How is ‘The Gauge’ created?
The data for The Gauge is derived from two separately weighted panels and combined to create the graphic. Nielsen’s streaming data is derived from a subset of Streaming Meter-enabled TV households within the National TV panel. The linear TV sources (broadcast and cable), as well as total usage are based on viewing from Nielsen’s overall TV panel.
Tutti i dati sono basati sul periodo di tempo per ciascuna fonte di visione. I dati, che rappresentano un mese di trasmissione, si basano sulle visualizzazioni Live+7 per l'intervallo di riferimento (nota: Live+7 comprende la visione della televisione in diretta e la visione fino a sette giorni dopo per i contenuti lineari).
Cosa si intende per "altro"?
Within The Gauge, “other” includes all other TV usage that does not fall into the broadcast, cable or streaming categories. This primarily includes all other tuning (unmeasured sources), unmeasured video on demand (VOD), audio streaming, gaming and other device (DVD playback) use.
Beginning with the May 2023 interval, Nielsen began utilizing Valutazioni dei contenuti in streaming to identify original content distributed by platforms reported in that service to reclassify content viewed via cable set top boxes. This viewing will credit to streaming and to the streaming platform which distributed it. It will also be removed from the other category, where it was previously reflected. Content not identified as original within Streaming Content Ratings and viewed through a cable set top box will still be included in other.
What is included in “other streaming”?
Streaming platforms listed as “other streaming” includes any high-bandwidth video streaming on television that is not individually broken out. Apps designed to deliver live broadcast and cable (linear) programming (vMVPD or MVPD applications like Sling TV or Charter/Spectrum) are excluded from “other streaming.”
Dove contribuisce lo streaming lineare?
Linear streaming (as defined by the aggregation of viewing to vMVPD/MVPD apps) is excluded from the streaming category as the broadcast and cable content viewed through these apps credits to its respective category. This methodological change was implemented with the February 2023 interval.
E lo streaming live su Hulu e YouTube?
Lo streaming lineare tramite app vMVPD (ad esempio, Hulu Live, YouTube TV) è escluso dalla categoria dello streaming. Hulu SVOD" e "YouTube Main" all'interno della categoria streaming si riferiscono all'utilizzo delle piattaforme senza l'inclusione dello streaming lineare.


