In a previous Need to Know article, we examined TV media buying and how it needs to evolve to meet the demands of today’s highly fragmented TV ecosystem. The playing field is changing rapidly, and buyers need new tools to understand and reach their target audiences.
L'une des principales priorités du secteur a été le développement d'une nouvelle mesure qui pourrait combiner l'échelle du big data avec la démographie et la précision statistique de la mesure basée sur un panel afin de générer des données de meilleure qualité.
Nielsen has spent years working out the best way to combine panels and big data, developing data partnerships with key players and thoroughly testing our new methodology in collaboration with industry stakeholders. Here are three findings that convinced us that the harmonious combination of big data and panel data was indeed the future of TV measurement.
Avec des données calibrées par les panels de Nielsen...
- Les notes zéro sont réduites dans les principales catégories démographiques (SCALE)
- L'erreur relative moyenne diminue (ACCURACY)
- L'écart-type diminue (STABILITÉ)
Voyons ce que nous entendons par "big data" et ce que les panels ont à voir avec cela.
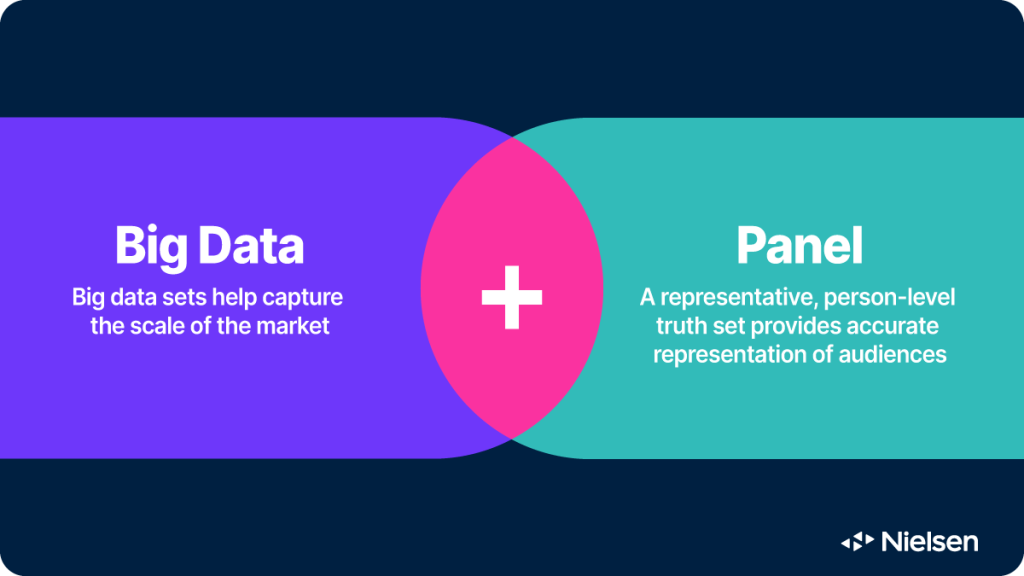
Big data et panels : Mieux ensemble
In the TV measurement space, big data refers to return-path data (RPD) from cable and satellite set-top boxes, as well as automatic content recognition (ACR) data from internet-connected smart TVs. How big is big data? Thanks to strategic data partnerships with companies like Comcast, DirecTV, Dish Network, Roku and Vizio, Nielsen currently has access to granular data from 75 million devices (and 45 million households) in the U.S. alone.

It’s a massive dataset, but it doesn’t capture TV viewing at the individual level—only at the device level. This makes it impossible to determine whether anyone is actually watching TV when the device is on or who the viewers and co-viewers might be at any point in time. To say nothing of the millions of households that don’t own any of those devices, only stream, watch TV over the air or have very different viewing habits than big data homes.
That’s where person-level panels come in. We’ve examined why panels still matter and how they should be used as a source of truth to overcome the limitations of big data. We followed those recommendations to develop the new National and Local TV currency for media buying and selling.
For instance, when we analyze RPD or ACR data at Nielsen today, we’re able to identify what devices are part of our panels and compare the tuning data in those homes to the individual viewing behavior captured by our meters. By using our panels as a source of truth, we’ve developed robust methods to calibrate big data, assign viewing to the right individuals, and project audience estimates to the entire TV population, not just those in the big data dataset.
Cette approche présente de nombreux avantages. En voici trois qui ressortent de nos analyses à ce jour.
Échelle : Les notes zéro sont réduites dans les principales catégories démographiques
When big data first emerged in the TV space, the immediate reaction from the industry was that it could help address one of its most vexing problems: zero-rated programs.
Thousands of TV shows have audiences that are too small to be detected by panel-based measurement, even with a panel of over 100,000 viewers. To give you an example, there were 362,168 telecasts in the first-quarter of 2023 across broadcast, cable and syndicated TV, and 13.9% of those telecasts showed zero viewers between the ages of 35 and 49 in any of our national and local TV panels.
But when we used our new Big Data + Panel methodology to examine those same telecasts, we found only 458 with no P35-49 viewers at all, or 0.1% of all telecasts that quarter. The rest were perfectly legitimate options for media buying, possibly with unique audience compositions.
In other words, our enhanced measurement can eliminate virtually all cases of zero-rating for that age group, with similar results across all other traditional age targets: 99.1% for P35-49, 98.4% for P18-34, and 99.6% for P50-64.
Les acheteurs et les vendeurs de médias y trouvent leur compte : Les vendeurs ont plus d'inventaire publicitaire à monétiser et les acheteurs ont plus d'options avec des audiences de niche pour atteindre leurs cibles.
Précision : Baisse de l'erreur relative moyenne
A key part of the process of blending big data and panel data is the application of calibration factors to every program to bring the aggregate audience in line with the panel at the station/daypart/demo level. Once demographics and viewers have been modeled, we use the big data to measure itself, and we compare the findings to those from our panel-based currency to inform the calibration factors.
Cela a pour effet de lisser les niveaux d'audience minute par minute et d'améliorer la précision des estimations d'audience par rapport à une solution basée uniquement sur le panel.
We measured how this new Big Data + Panel calibration method performed against the existing panel-based currency in the New York designated market area (DMA) in May 2023 and found that the average relative error for audience estimates in that market decreased anywhere between 10% (for the early fringe daypart) and 25% (for primetime and late fringe).
Une meilleure précision signifie que les acheteurs et les vendeurs de médias peuvent commencer à effectuer des transactions avec plus de confiance.
Stabilité : L'écart-type diminue
In that same market and for the same month of May 2023, Nielsen examined the impact of the new currency on the stability of audience estimates for the 6AM news shows.
National broadcast and cable news programs tend to draw loyal followers day in and day out; the same is supposed to be true for local news shows, but it’s always been difficult to verify considering the size of some of our local TV panels. Local stations have struggled to understand whether day-to-day variations in audience size are the result of actual fluctuations or an artifact of panel-based measurement.
Looking closely at two separate 6AM news shows in the New York area, we found that the standard deviation of their audience size over the course of the month was 36% lower with the new currency than with the panel-only currency as big data brings stability to estimates by reducing the impact of a single panel home.
Quel sera l'impact de nos mesures améliorées sur votre entreprise ?
No more zero-ratings, better accuracy and much improved stability. What’s not to like? We’ve been refining our new TV currency for years now, and now as the only accredited, Big Data + Panel solution with persons-level granularity, the media industry can trade on accurate, reliable measurement with confidence. We sincerely believe that it’s going to open a new chapter for Mesure de la télévision and benefit all stakeholders.
To learn more about it and assess its impact on your business, please get in touch with our experts and discover the power of Big Data + Panel measurement.
Nielsen’s Need to Know reviews the fundamentals of audience measurement and demystifies the media industry’s hottest topics. Read every article here.


