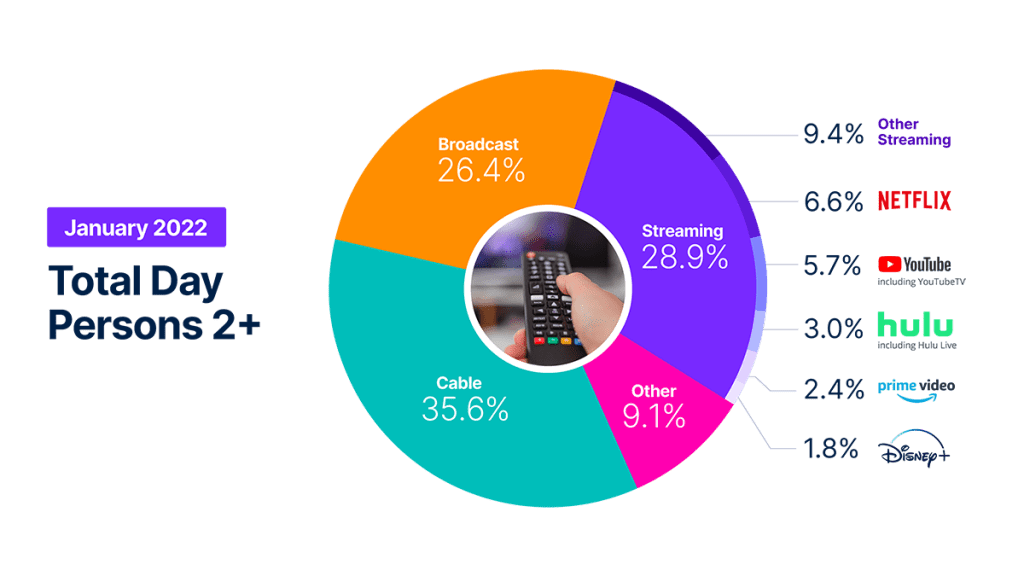
The first week of January handily shattered previous streaming records with 197.6 billion viewing minutes, with Christmas week 2021 now taking second place of the highest level of streaming recorded (with 183 billion viewing minutes). This 12% uptick in monthly volume was the highest of any category, and resulted in a 1.1% increase in streaming share to set another record at 28.9% of television usage. For the month of January, streaming averaged 180 billion minutes per week – the highest average weekly figure of any month since Nielsen introduced streaming measurement.
Broadcast consumption was up 9% versus December, a trend driven by arguably the most compelling NFL playoffs ever–and increased engagement with refreshed broadcast dramas, up 22% compared to the previous month. The cable category, despite being up 3% in usage, lost 1.7 share points to finish at 35.6% of television viewing, primarily driven by the seasonal shift away from holiday movies.


Je vous invite à consulter les détails de la méthodologie ci-dessous.
Watch the video to hear Brian Fuhrer, SVP, Product Strategy at Nielsen provide a behind the scenes look at some of the viewing changes underpinning The Gauge.
METHODOLOGY AND FREQUENTLY ASKED QUESTIONS
The Gauge provides a monthly macroanalysis of how consumers are accessing content across key television delivery platforms, including Broadcast, Streaming, Cable and Other sources. It also includes a breakdown of the major, individual streaming distributors. The chart itself shows the share by category and of total television usage by individual streaming distributors.
The data for The Gauge is derived from two separately weighted panels and combined to create the graphic. Nielsen’s streaming data is derived from a subset of Streaming Meter-enabled TV households within the National TV panel. The linear TV sources (Broadcast and Cable), as well as total usage are based on viewing from Nielsen’s overall TV panel.
All the data is based on a specific time period for each viewing source. The data, representing a 5 week month, includes a combination of Live+7 for weeks 1 – 4 in the data time period. (Note: Live+7 includes live television viewing plus viewing up to seven days later. Live +3 includes television viewing plus viewing up to three days later.)
Within The Gauge, “Other” includes all other TV. This primarily includes all other tuning (unmeasured sources), unmeasured video on demand (VOD), streaming through a cable set top box, gaming, and other device (DVD playback) use. Because streaming via cable set top boxes does not credit respective streaming distributors, these are included in the “Other” category. Crediting individual streaming distributors from cable set top boxes is something Nielsen continues to pursue as we enhance our Streaming Meter technology.
Les plateformes de diffusion en continu répertoriées dans la catégorie "Autres diffusions en continu" comprennent toutes les diffusions vidéo à large bande à la télévision qui ne sont pas ventilées individuellement.
Yes, Hulu includes viewing on Hulu Live and Youtube includes viewing on Youtube TV.
Encoded Live TV, aka encoded linear streaming, is included in both the Broadcast and Cable groups (linear TV) as well as under Streaming and other streaming e.g. Hulu Live, Youtube TV, Other Streaming MVPD/vMVPD apps. (Note: MVPD, or multichannel video programming distributor, is a service that provides multiple television channels. vMVPDs are distributors that aggregate linear (TV) content licensed from major programming networks and packaged together in a standalone subscription format and accessible on devices with a broadband connection.)