Paramount apresenta o maior aumento mensal no indicador de distribuidores de mídia de abril, impulsionado pela CBS
A Disney e a NBCUniversal também ganharam participação
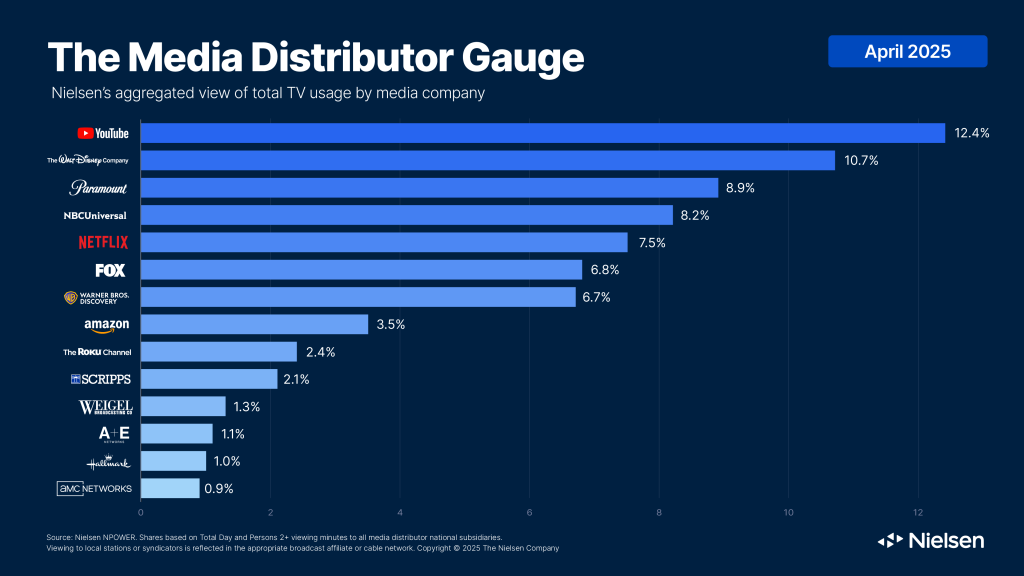
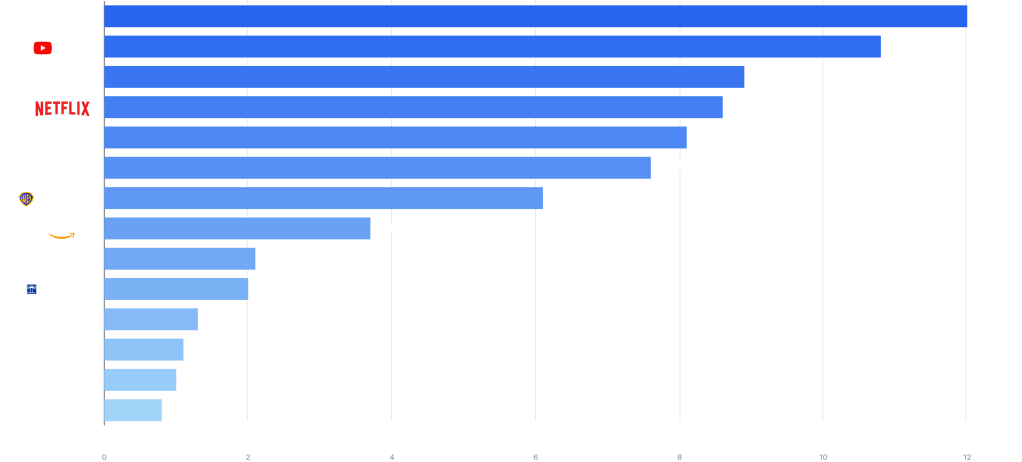
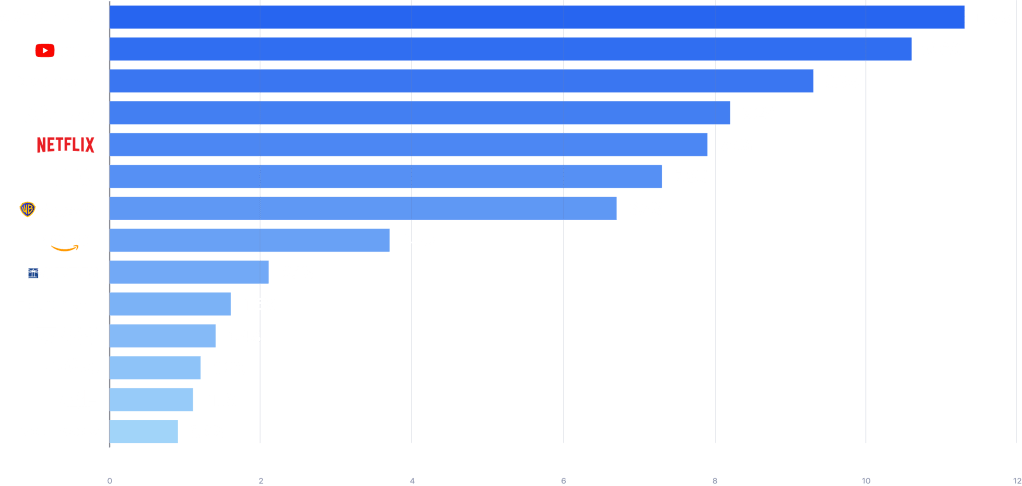
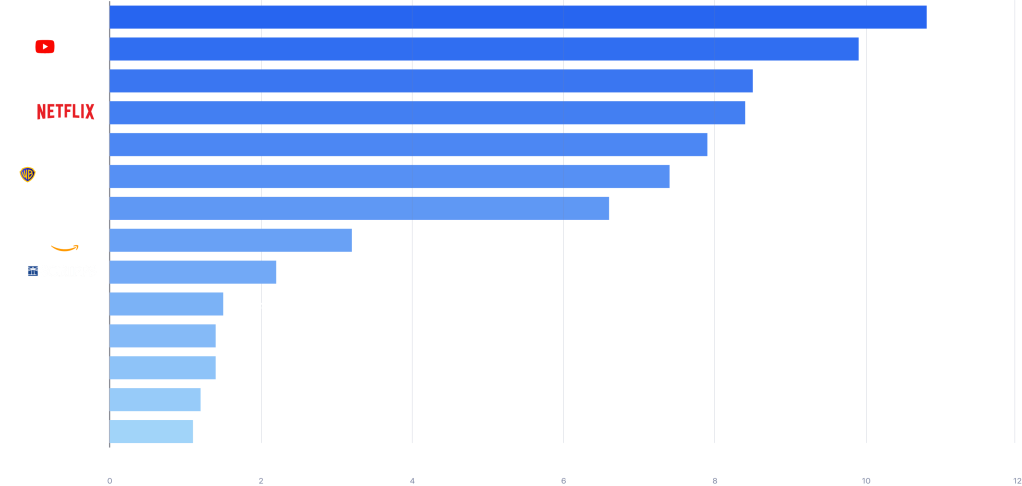
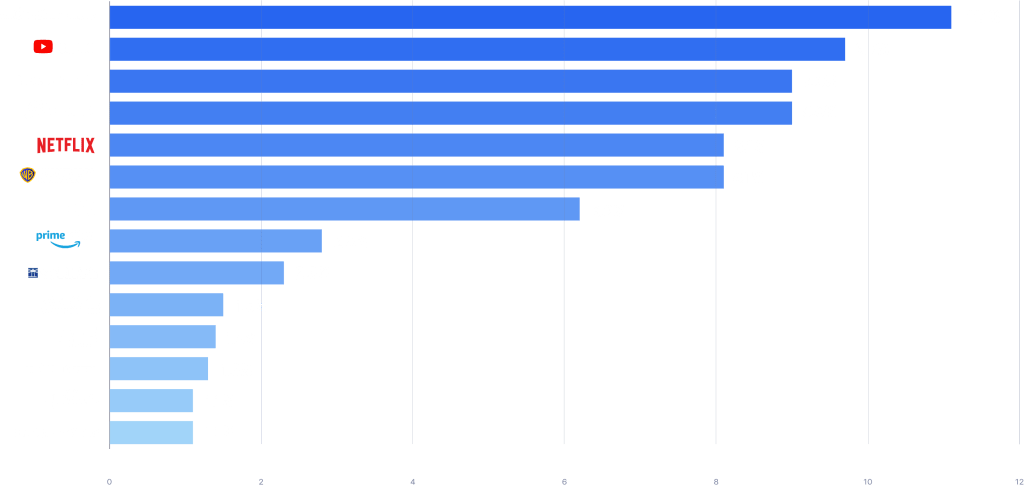
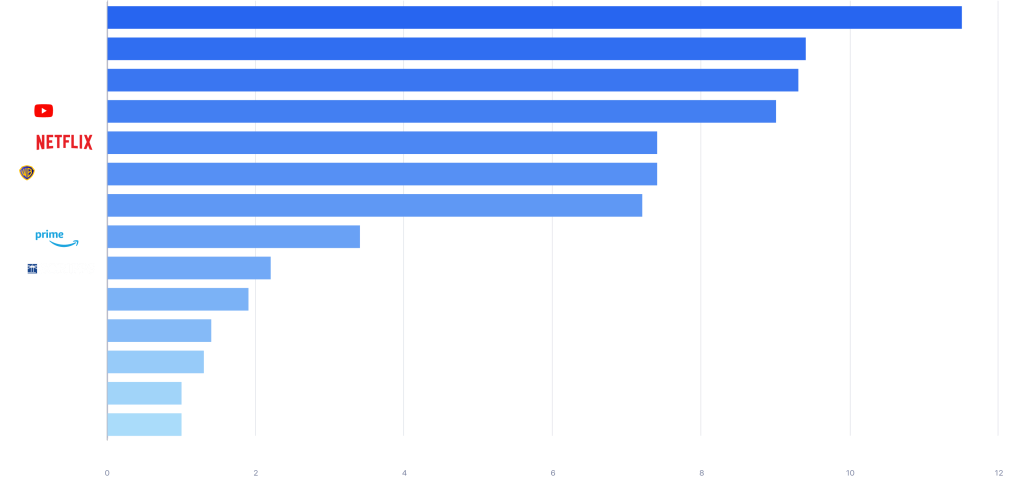
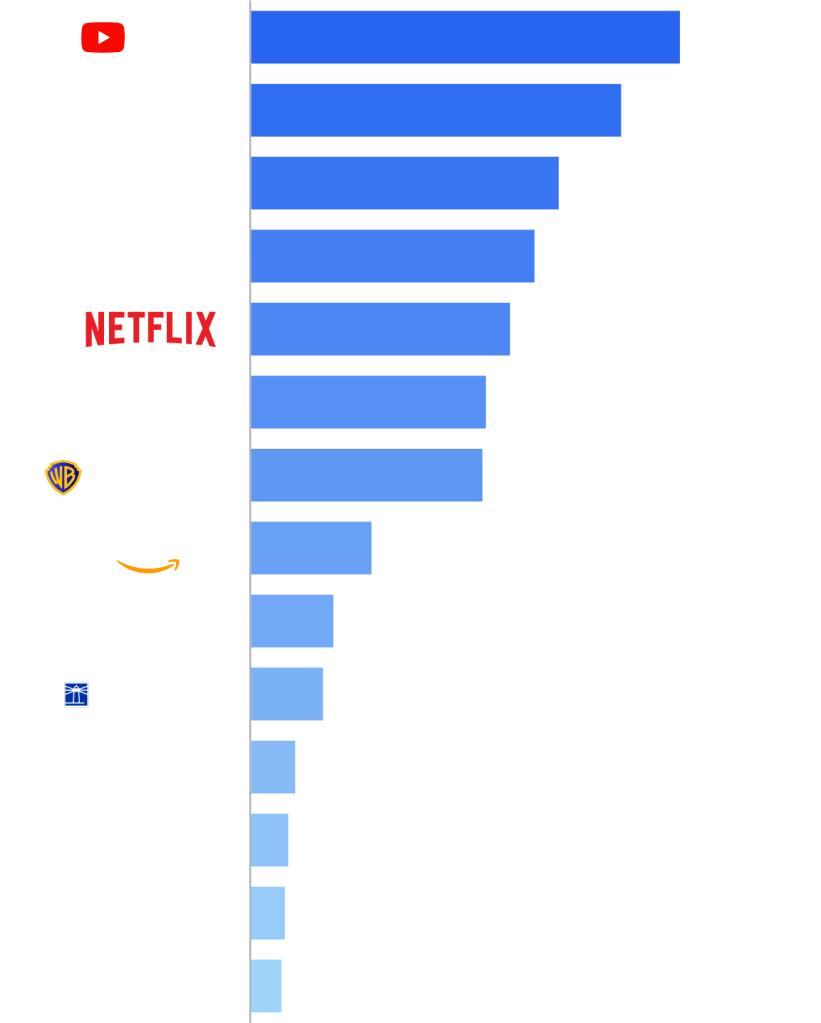
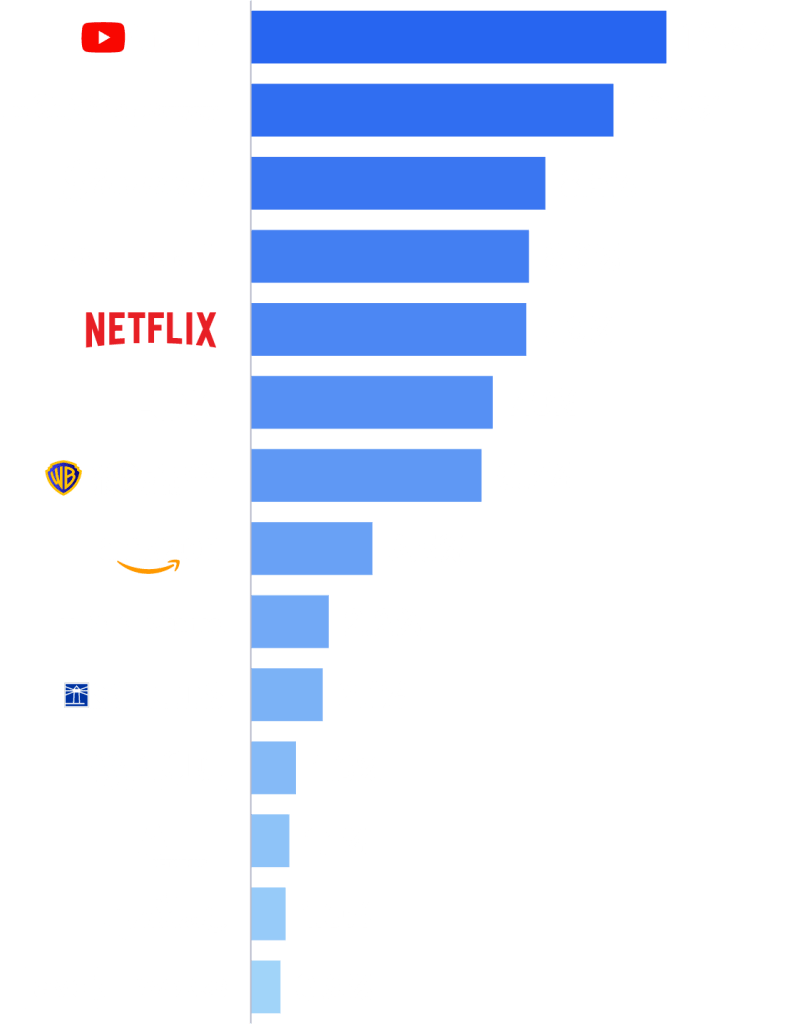
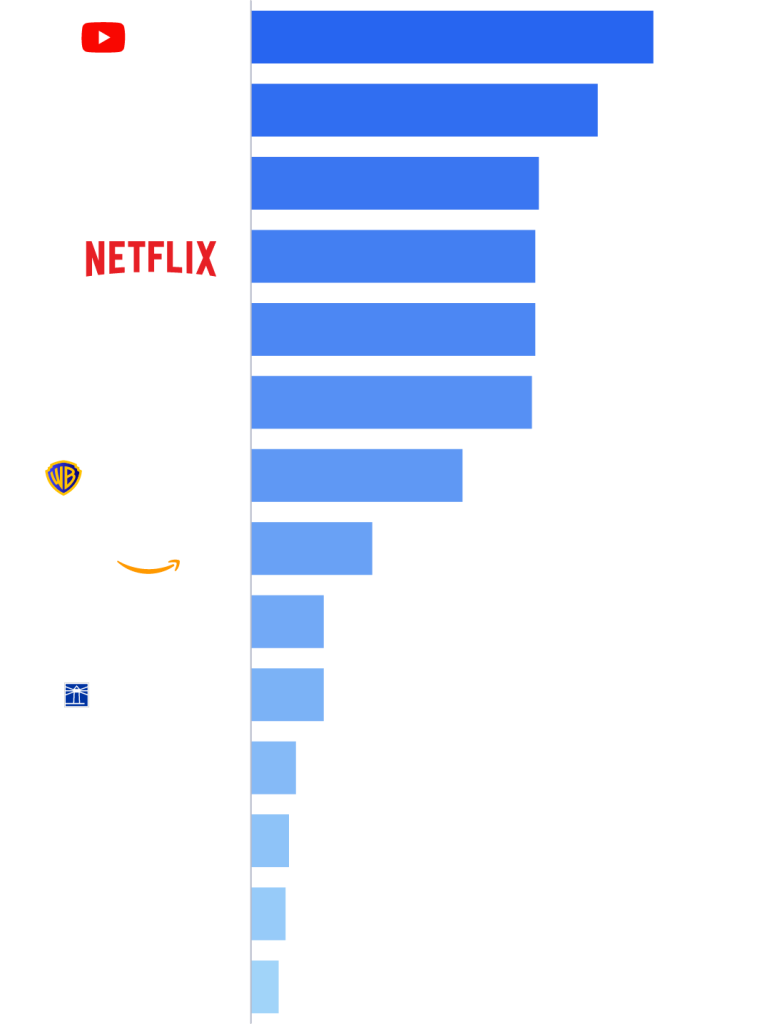
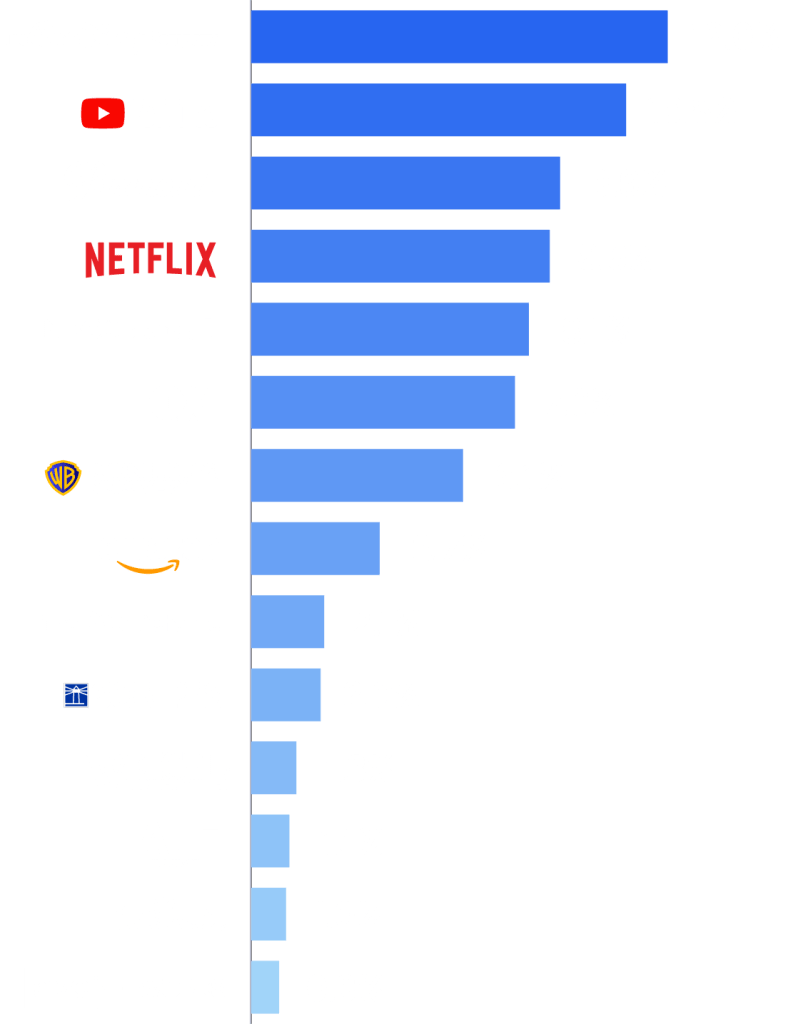
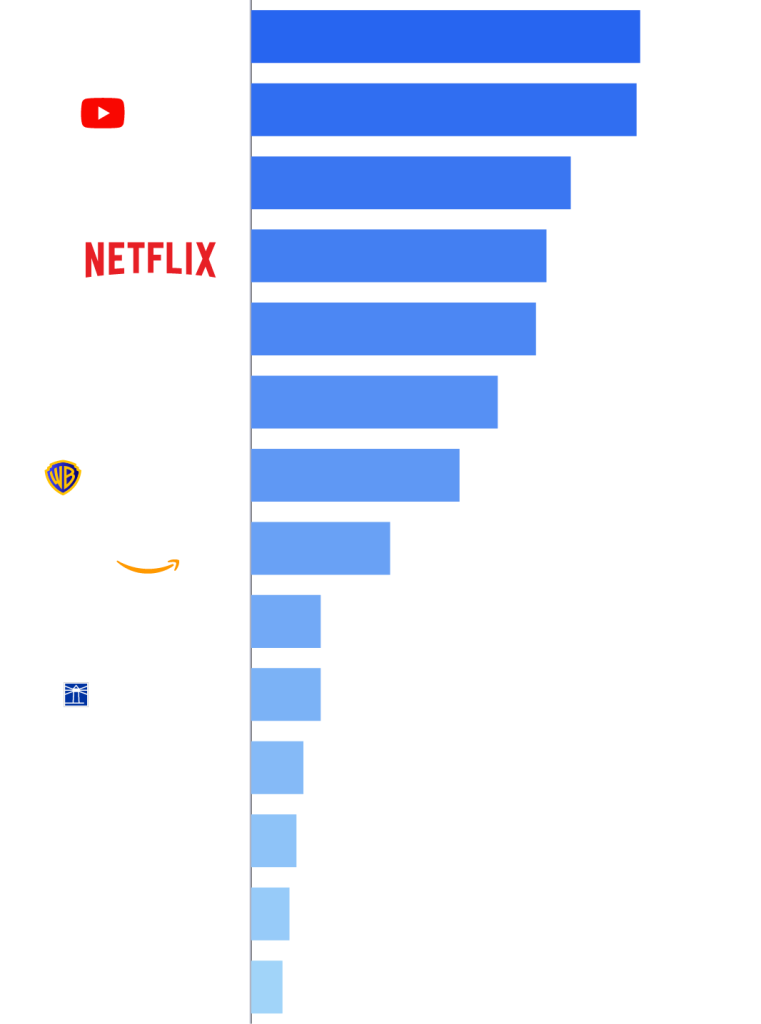
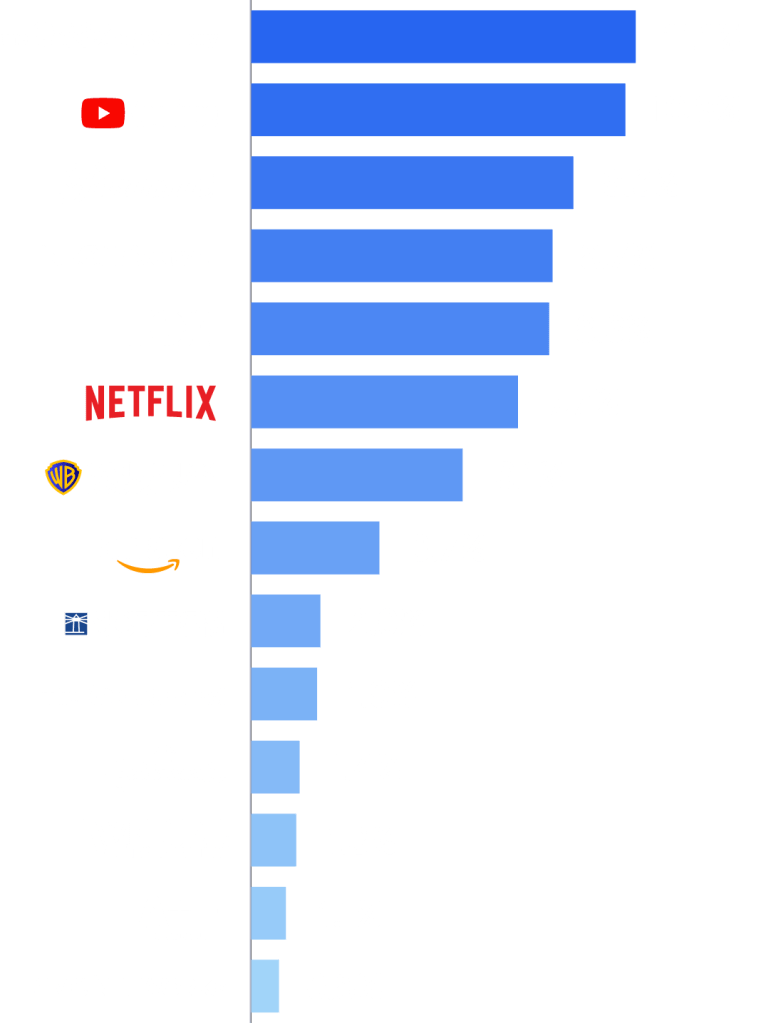
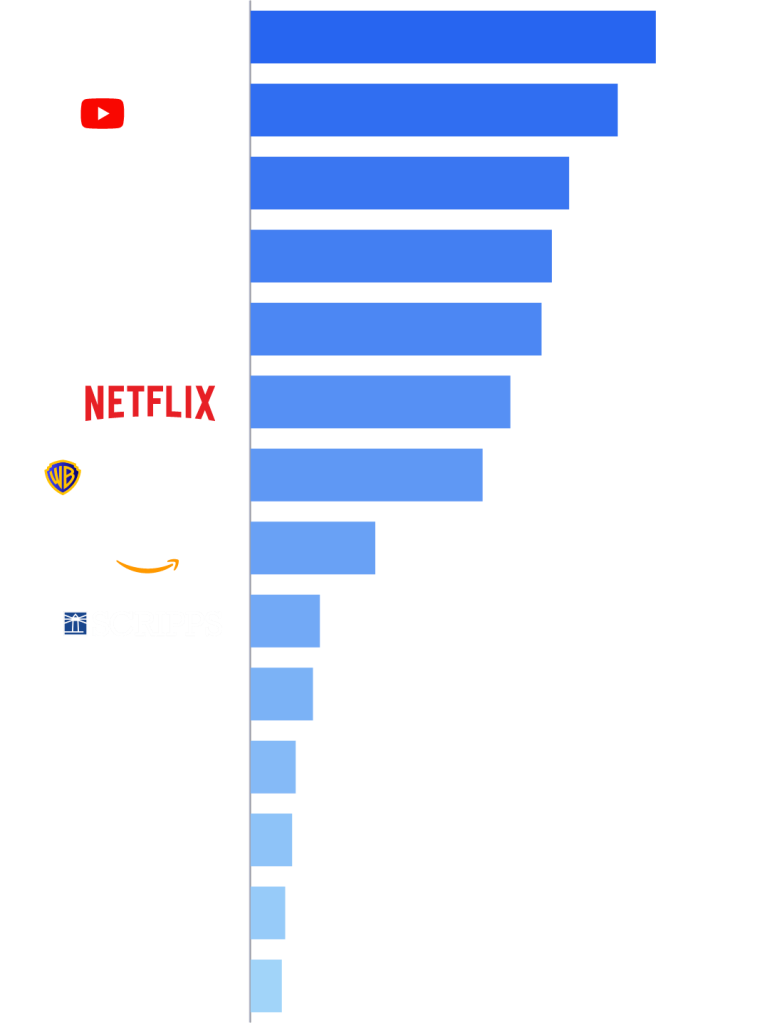
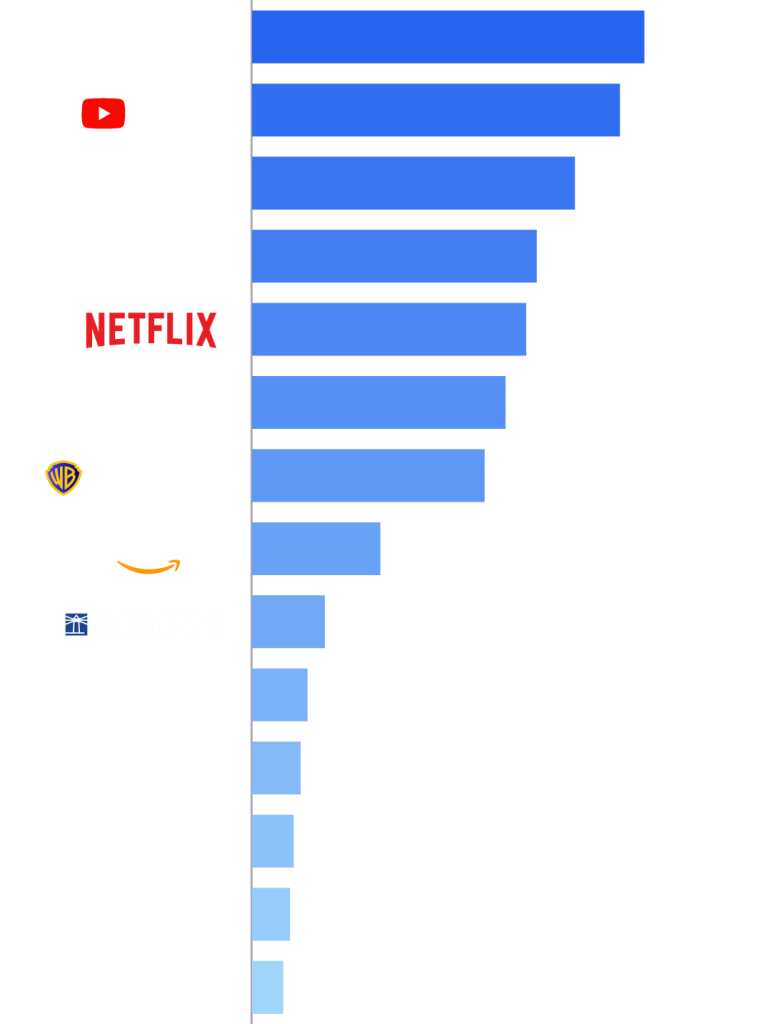
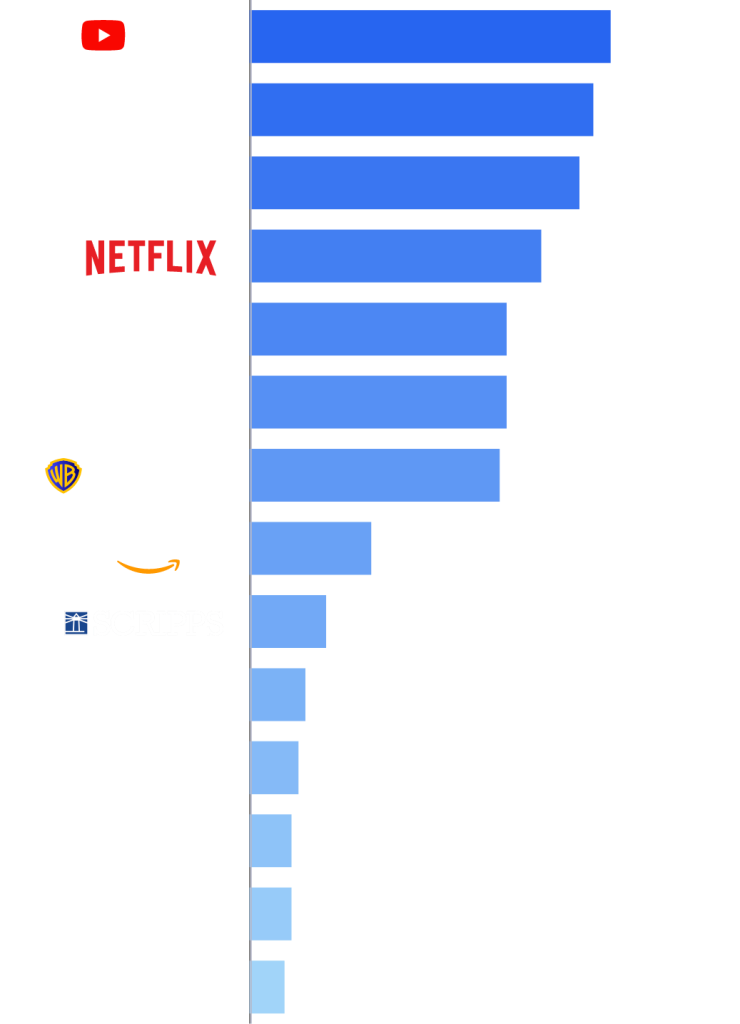
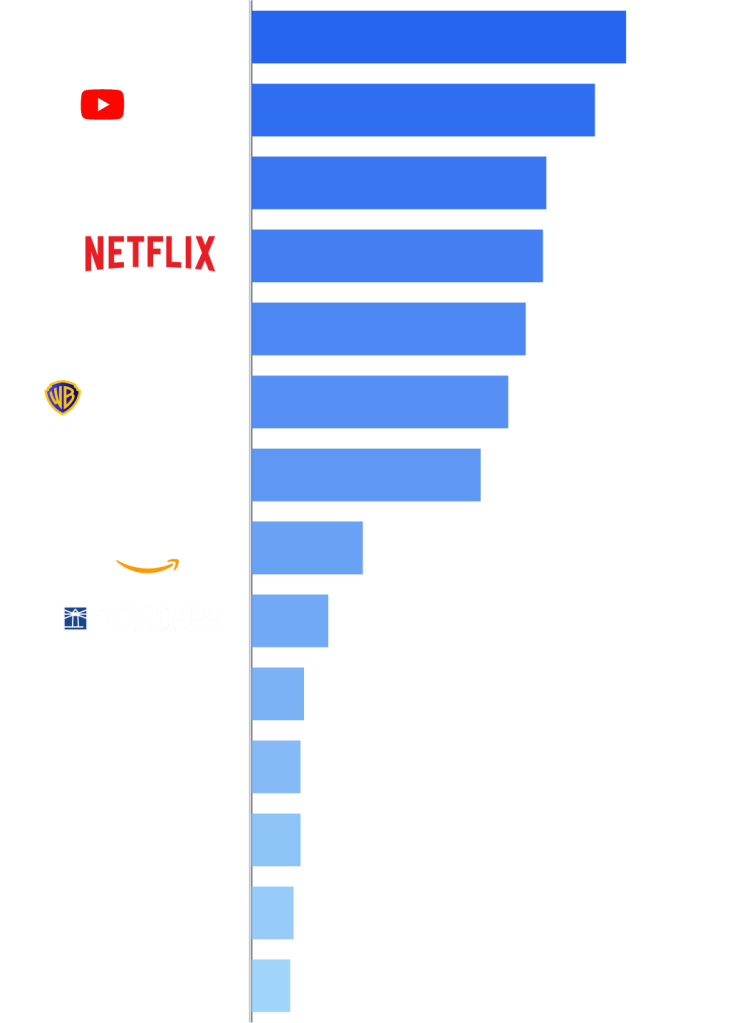
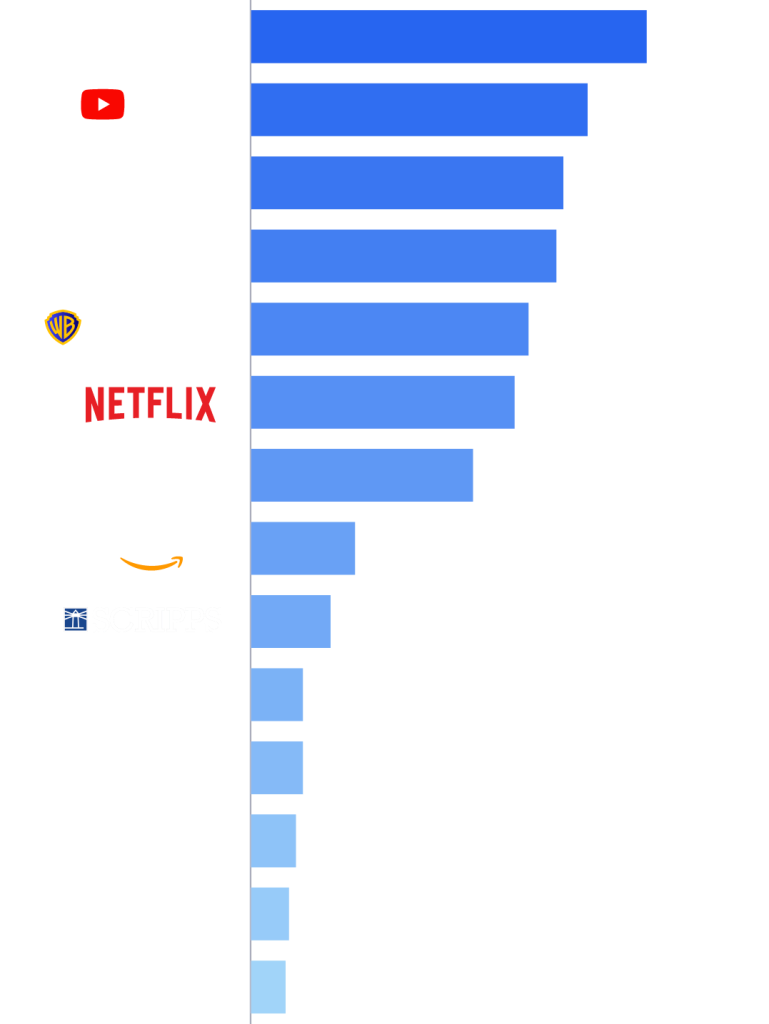
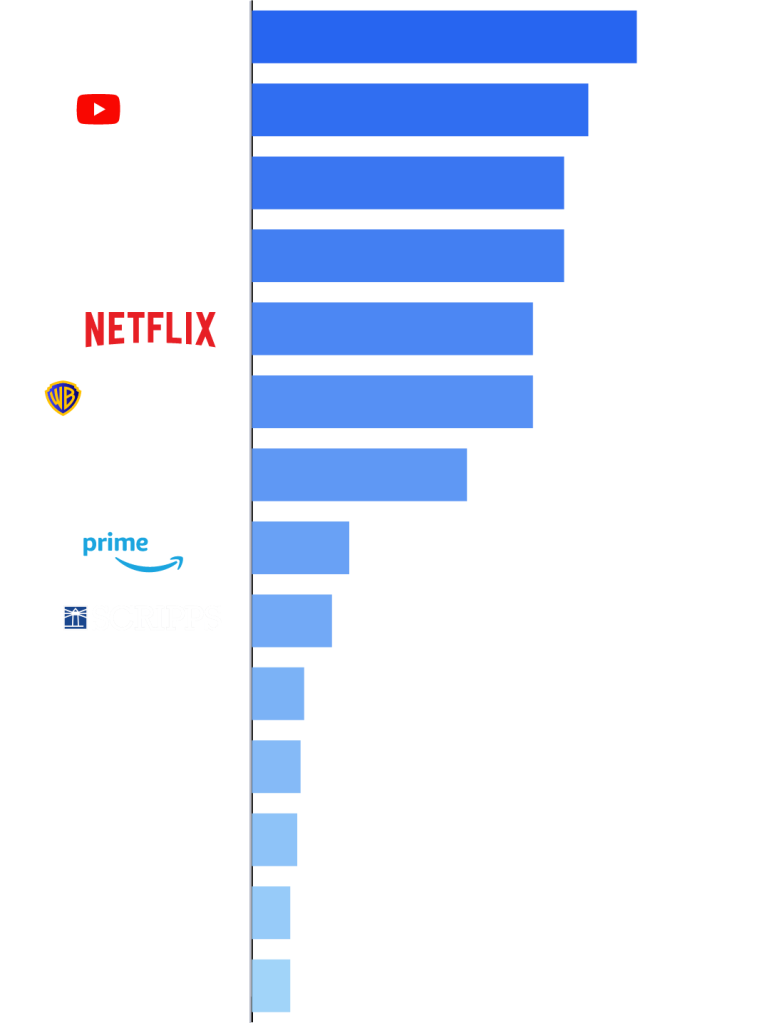
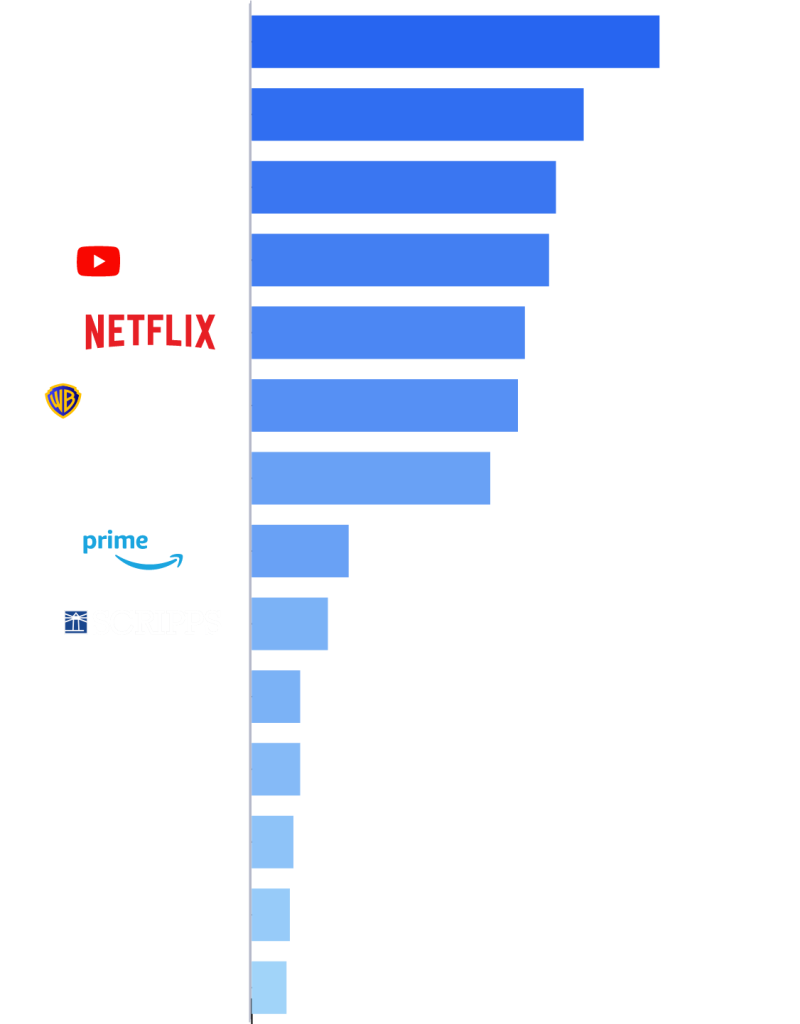
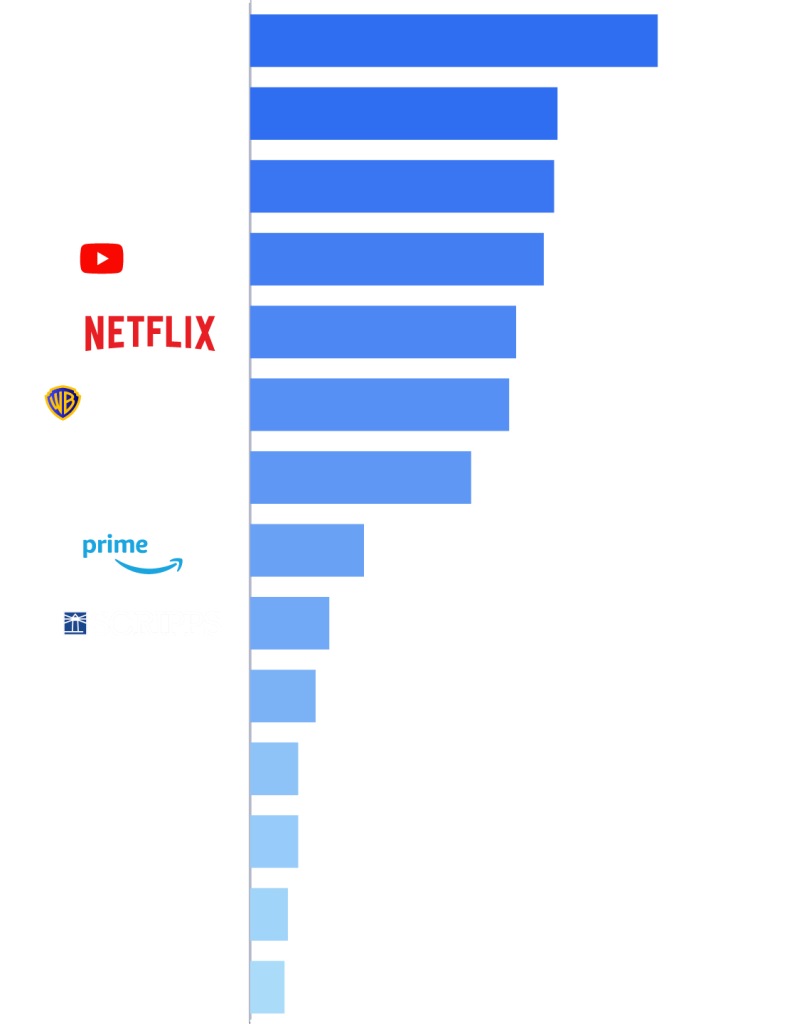
NEW YORK - May 27, 2025 – YouTube maintained its lead among media companies in Nielsen’s April 2025 Media Distributor Gauge report, representing 12.4% of audiences’ time spent watching television. This marks YouTube’s third consecutive month atop the Media Distributor Gauge, as well as its largest share of TV to date.
April 2025 is the first time that company rankings in the Media Distributor Gauge have stayed exactly the same month over month since Nielsen began tracking this data in November 2023. Disney held the second largest share of TV in both April and March, and this month represented 10.7% of total television. Disney’s 0.2 point gain over March was partly driven by cross-network coverage of the NFL Draft, the NCAA Women’s Basketball Championship and the first round of the NBA Playoffs. Disney also owned April’s top streaming title, Anatomia de Grey, which notched 3.9 billion viewing minutes and benefited from its multichannel and multiplatform availability.
A Paramount representou 8,9% do tempo total de exibição de TV em abril e apresentou o maior aumento mensal de participação entre as empresas de mídia (+0,4 pontos, o que, com base em números não arredondados, foi ligeiramente maior do que o aumento do YouTube). Os ganhos de audiência para suas afiliadas de transmissão da CBS impulsionaram mais da metade do crescimento mensal da Paramount. A NBCUniversal completou os quatro principais distribuidores de mídia em abril, com uma participação de 8,2% na TV, acima dos 8,0% em março.
Warner Bros. Discovery maintained 6.7% of TV usage this month, boosted by a 58% lift in viewership to TNT, which televised 18 first round games of the NBA Playoffs (through April 27). WBD was also buoyed by its HBO series The White Lotus, which was the second most watched streaming title in April with 3.7 billion viewing minutes on Max. The White Lotus was also No. 1 in Nielsen’s Streaming Top 10 during the weeks of 03/31/25 – 04/06/25 and 04/07/25 – 04/13/25, totaling 1.31 billion minutes and 1.25 billion minutes, respectively.
O intervalo de abril de 2025 incluiu as datas de 31/03/2025 a 28/04/2025. Os relatórios da Nielsen seguem o calendário de transmissão com semanas de medição que vão de segunda a domingo.


Sobre o The Gauge™
O Gauge™ is Nielsen’s monthly snapshot of total broadcast, cable and streaming consumption that occurs through a television screen, providing the industry with a holistic look at what audiences are watching. The Gauge was expanded in April 2024 to include O medidor do distribuidor de mídia, which reflects total viewing by media distributor across these categories. Read more about The Gauge methodology and FAQs.
Sobre a Nielsen
Nielsen is a global leader in audience measurement, data and analytics. Through our understanding of people and their behaviors across all channels and platforms, we empower our clients with independent and actionable intelligence so they can connect and engage with their global audiences—now and into the future. Learn more at www.nielsen.com and connect with us on social media (X, LinkedIn, YouTube, Facebook e Instagram).
Press Contact
Lauren Pabst
