Com base no The Gauge™, que define o setor, o novo insight mostra uma visão total de plataforma cruzada do envolvimento do público por empresa de mídia.
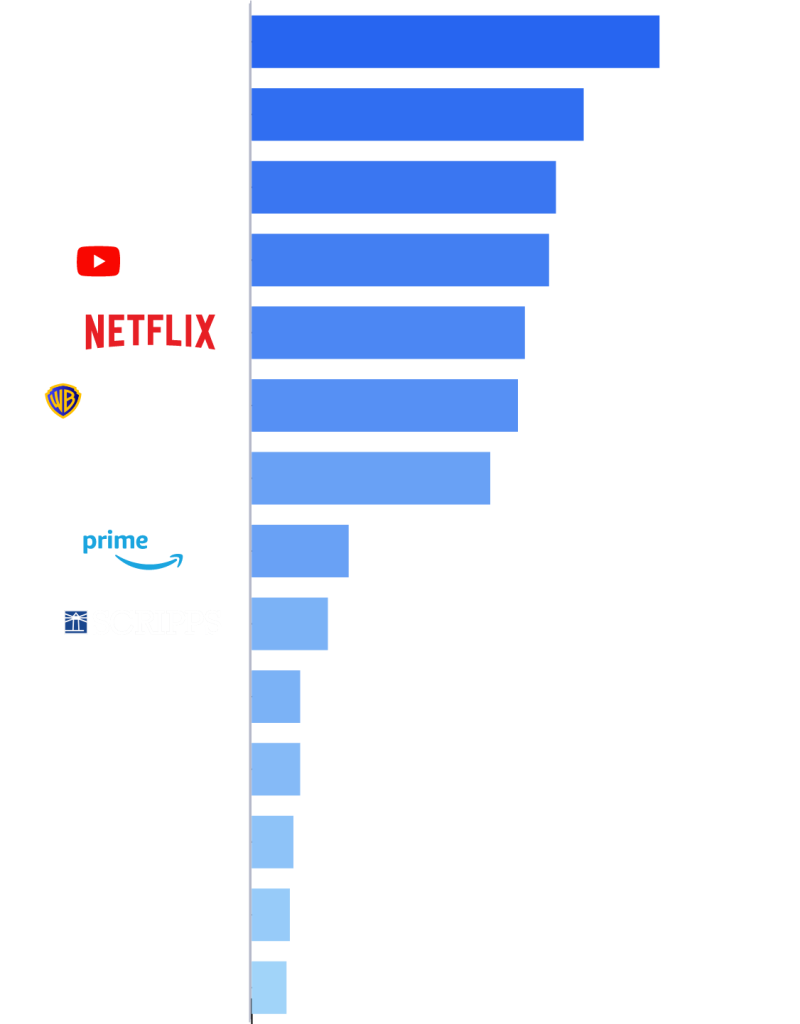
A Disney está no topo do Media Distributor Gauge de abril, com 11,5% do tempo gasto assistindo à TV.
NEW YORK - May 14, 2024 – Nielsen, a global leader in audience measurement, data and analytics, today launched O medidor do distribuidor de mídia, a first of its kind, cross-platform view of total TV consumption across broadcast, cable and streaming, aggregated and ranked by media company. The new insight removes the siloes of traditional television versus streaming, and puts all content distributors on a level playing field to allow for additional perspective of TV viewing today. This new view is being released in addition to The Gauge™ report for April 2024, which is detailed below.
"Com mais programas disponíveis em várias plataformas, é vital para os criadores, anunciantes e o setor em geral entender o que e onde o público está assistindo", disse Karthik Rao, CEO da Nielsen. "O Media Distributor Gauge é um complemento perfeito para o The Gauge e serve como a primeira comparação de TV convergente desse tipo. Juntos, esses relatórios traçam o quadro mais completo da exibição de TV atualmente, o que é fundamental à medida que nos aproximamos do Upfront."
Esse novo insight é criado por meio do mapeamento de todos os vários distribuidores nacionais de mídia - incluindo redes de transmissão e a cabo e serviços de streaming - até sua empresa controladora. A Nielsen calcula o total de minutos assistidos na tela da TV para os serviços de cada rede e agrega esses totais com base no mapeamento inicial do distribuidor, chegando a uma parcela do uso total da TV para cada empresa controladora. O limite mínimo de relatório para uma empresa matriz no The Media Distributor Gauge é uma participação de 1,0% na TV. Semelhante à flutuação do uso mensal de TV monitorado no The Gauge, as classificações na visualização da empresa de mídia também demonstrarão mudanças que se correlacionam com a sazonalidade da exibição de TV.
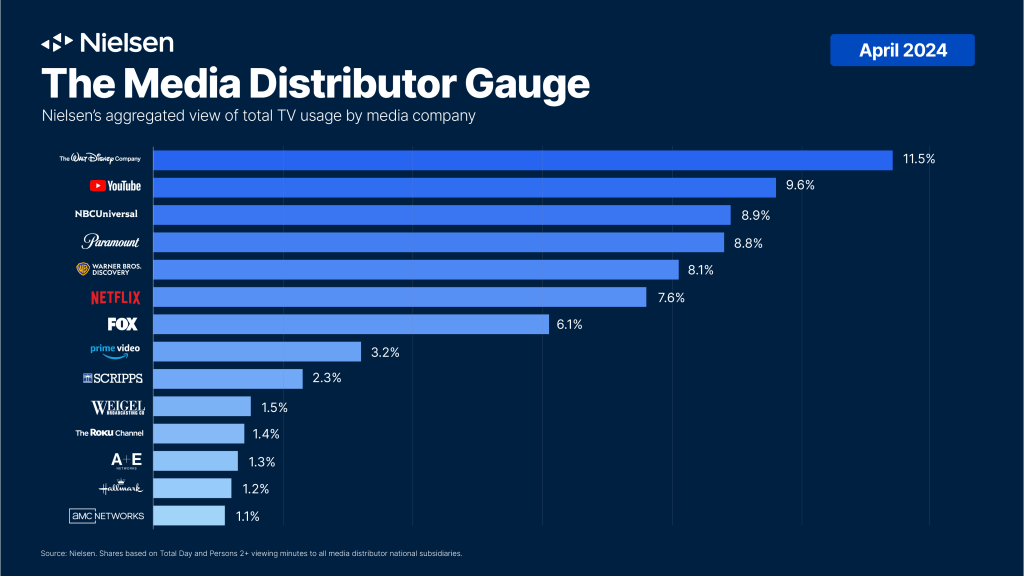
No primeiro relatório da Nielsen do The Media Distributor Gauge, 14 empresas de mídia alcançaram uma participação de 1,0% ou mais no uso total da TV. Com o melhor desempenho em abril, a Disney foi responsável por 11,5% das visualizações de TV, com 42% de sua participação atribuível à visualização no Disney+ e no Hulu. O YouTube foi a segunda empresa geral, com uma participação de 9,6% na TV em abril, seguido pela NBCUniversal, com 8,9%, Paramount, com 8,8%, e Warner Bros. Discovery, com 8,1%, completando os cinco primeiros. A Netflix ficou em sexto lugar, com 7,6% da TV, e foi o segundo maior distribuidor de streaming registrado.


O Gauge™: O instantâneo mensal da Nielsen do uso total da TV em abril de 2024
O mês de abril foi marcado por recordes de audiência: a cobertura do torneio de basquete feminino da NCAA na TV aberta e a cabo e a nova série original da Amazon Prime Video, Fallout, que estabeleceu um novo recorde para o streamer como seu programa de maior sucesso até o momento. Do ponto de vista do uso geral, o tempo gasto assistindo à TV ficou relativamente estável tanto no mês a mês (queda de 2%) quanto em uma base anual (queda de 0,6%).

Nas principais categorias de visualização:
- Cabo was the only category in The Gauge to escape decline as it achieved a second consecutive monthly increase in share, moving up from 28.3% of TV in March to 29.1% (+0.8 pt.) in April. Cable sports viewing increased 28% vs. March, bolstered by NCAA basketball tournament coverage, NBA playoffs and the NFL draft. Women’s NCAA basketball finals and semifinals coverage accounted for four of the top six cable telecasts in April, and the WNBA draft notched 17th. While cable viewing increased about 1% on a monthly basis, a year-over-year comparison shows viewing has declined 8.2% vs. April 2023, and its share has lost 2.4 points.
- Transmissão viewing was down 3% in April, which equated to a 22.2% share of TV (-0.3 pt.). Similar to cable, women’s sports were the bright spot in the broadcast category this month. The NCAA women’s basketball championship game drew 17.6 million viewers on ABC (plus over 1 million more tuned in on ESPN), making it the top broadcast telecast in April by a large margin. The drama genre accounted for 29% of broadcast viewing, driven by Tracker, NCIS and Young Sheldon on CBS, and Chicago Fire and Chicago Med on NBC.
- Transmissão em fluxo contínuo viewership declined 1.9% from March to April, prompting the category to lose just 0.1 share point to account for 38.4% of total television. Amazon Prime Video saw the largest increase among streaming services this month with a 12% monthly increase for 3.2% of TV (+0.4 pt.). Prime Video’s April success was driven by its original series Fallout, which also topped all streaming titles this month with over 7 billion viewing minutes. YouTube, despite a 3% monthly decline in viewing, added a 15th month to its streak as the top streaming platform in The Gauge with a 9.6% share of TV in April.
Sobre o The Gauge™
O Gauge™ is Nielsen’s monthly snapshot of total broadcast, cable and streaming consumption that occurs through a television screen. It was expanded in the April 2024 report to include The Media Distributor Gauge, which reflects total viewing by media distributor across these categories. Underpinned by Nielsen’s National TV measurement and Streaming Platform Ratings services, in addition to complimentary insights from its Streaming Content Ratings service, The Gauge provides the industry with a holistic look at the various content audiences are watching. The latest edition of The Gauge is always available at nielsen.com/thegauge.
Sobre a Nielsen
Nielsen shapes the world’s media and content as a global leader in audience measurement, data and analytics. Through our understanding of people and their behaviors across all channels and platforms, we empower our clients with independent and actionable intelligence so they can connect and engage with their audiences—now and into the future. Nielsen operates around the world in more than 55 countries. Learn more at www.nielsen.com and connect with us on social media (Twitter/X, LinkedIn, Facebook e Instagram).
Press Contact
Lauren Pabst
lauren.pabst@nielsen.com
