A Nielsen Ad Intel mostra um grande salto nos gastos com publicidade, já que os profissionais de marketing consideram os anúncios como o principal impulsionador do crescimento em um mercado altamente competitivo
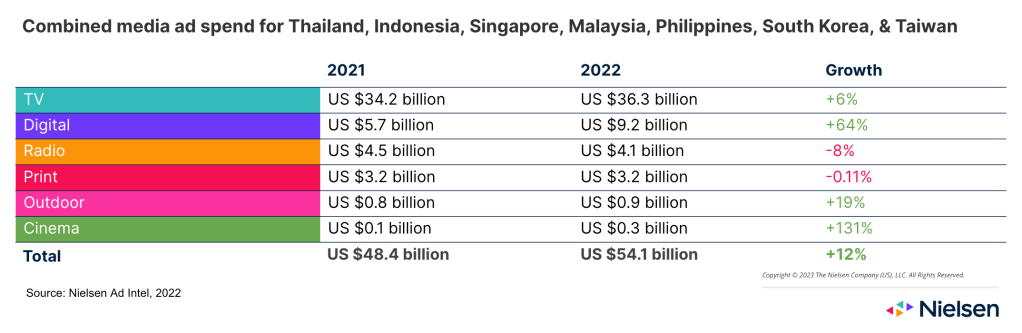
Singapore – March 31, 2023 – New data from Nielsen Ad Intel, the region’s leading comprehensive ad spend monitoring service, shows investment in advertising in Thailand, Indonesia, Singapore, Malaysia, Philippines, South Korea and Taiwan jumped by almost US$55 billion in 2022 – an overall increase of 12%.
O aumento foi liderado pela publicidade digital, que cresceu 64% em relação a 2021, seguida pela publicidade externa, com 19%, e pela TV, com 6%. Como as multidões voltaram aos cinemas, a publicidade no cinema também se recuperou, crescendo 131%, enquanto o rádio caiu 8%.
Nielsen Asia President (Commercial), Arnaud Frade said, “These Ad Intel numbers for 2022 show marketers backing advertising as the best, most cost-effective way to connect brands with customers and keep them engaged. What they also demonstrate is that marketers need to be more savvy than ever about how they invest those ad dollars, utilising the very best data, in order to get an edge on their competition and maximise their ROI.”
Those kind of insights are not only an advantage, but absolutely crucial in the highly competitive Asian market, says Nielsen Asia Managing Director (Advertisers), Aaron Rigby: “As the advertising environment becomes more complex, brands, agencies and media owners need the latest advertising intelligence to differentiate themselves from the competition and to carve out the best path forward for their brands and media. Nothing does better than Nielsen’s Ad Intel in helping you understand the advertising around you to improve your own .”
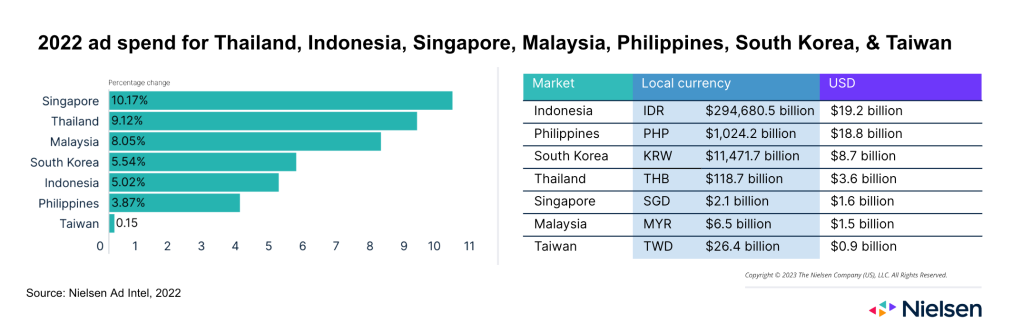
A Nielsen Ad Intel, que rastreia a atividade de anúncios competitivos no nível da marca em todo o cenário de mídia, analisou detalhadamente mercados asiáticos selecionados* para fornecer um instantâneo em nível local do investimento em anúncios, do gasto total, do crescimento ano a ano e dos fatores determinantes.
Em nível de país, e não de canal, Cingapura liderou o aumento ano a ano com um crescimento de 10,17%. A Tailândia e a Malásia vieram logo em seguida, com crescimento de 9,12% e 8,05%, respectivamente.
*Os dados incluem apenas os seguintes mercados selecionados na Ásia: Tailândia, Indonésia, Cingapura, Malásia, Filipinas, Coreia do Sul e Taiwan
Instantâneo dos gastos com anúncios em 2022 por mercado
Indonesia
US $19.2 billion
+5.02% from 2021
Online shopping and gaming led ad spend in Indonesia, which reached $19.2* billion for the year – a 5.02% increase from 2021, with TV, internet, and print media leading the way. Unilever, Mayora, and Valorant were the top three spenders.
*O número é baseado em um cartão de tarifa bruta que exclui descontos e bônus.
Filipinas
US $18.8 billion
+3.87% from 2021
Philippines’ ad spend reached $18.8 billion in 2022, up 3.87%*. The personal care and hygiene industry, led by Procter & Gamble and Unilever Philippines dominated the list of top spenders.
*Não inclui mídia digital (monitor digital a partir de 2022).
Coreia do Sul
US $8.7 billion
+5.54% from 2021
South Korea’s ad spend rose to $8.7 billion in 2022, up by 5.54%. The biggest spenders were tech companies, with Samsung leading the list, followed by LG Electronics and KT Corporation. HiteJinro was the only non-tech company in the top five advertisers.
Tailândia
US $3.6 billion
+9.12% from 2021
Thailand’s ad spend increased by 9.12% in 2022 with FMCG companies topping the list. Unilever, Procter & Gamble, and Nestle were the biggest spenders, helping Thailand’s ad spend grow to $3.6 billion for the year. TV and digital media were the most utilised ad channels, with outdoor and cinema also seeing significant growth.
Cingapura
US $1.6 billion
+10.17% from 2021
Singapore’s ad spend reached $1.6 billion in 2022 – an increase of 10.17%. The highest spend came from social, followed by TV and outdoor. The list of top spenders was dominated by e-commerce and retail brands, with Lazada, NTUC FairPrice, and Amazon leading the pack.*
*Gastos com anúncios sociais disponíveis a partir de setembro de 2021.
Malásia
US $1.5 billion
+8.05% from 2021
Malaysia’s ad spend reached $1.5 billion in 2022 – a growth of 8.05%. TV, digital, and newspapers had the highest share. Fast food saw the highest growth, increasing 35% as McDonald’s, KFC, and Pizza Hut topped the category list.
Taiwan
US $900 million
+0.15% from 2021
Taiwan’s ad spend rose slightly to $900 million in 2022, with TV being the most prominent medium. Health food topped the list of categories, with Procter & Gamble Home Products, Suntory Wellness Taiwan, and Standard Foods among the biggest spenders.
About Nielsen Ad Intel
O Ad Intel fornece a fonte mais completa de inteligência de publicidade em várias plataformas disponível atualmente. Com um software intuitivo, analise e compare a atividade de anúncios entre mídias, empresas, categorias ou marcas, além de dados históricos.
Observação: a Nielsen monitora os gastos brutos com publicidade na mídia principal, de acordo com os valores publicados na tabela de preços. Embora alguns proprietários de mídia ofereçam descontos, as taxas não estão disponíveis abertamente. Observe também que os números dos agrupamentos de categorias e marcas/produtos são agrupados a critério da Nielsen.
Media Contacts
Dan Chapman
Diretor adjunto de comunicações da Nielsen APAC
dan.chapman@nielsen.com
+61 404 088 462
Kyoji Nakao
Communications Manager, Communications, Nielsen APAC
kyoji.nakao@nielsen.com
+81-80-4597-4256
