A Nielsen Streaming Platform Insights revela:
- 10.1 billion1 in-home minutes spent streaming, representing one-fifth of all video consumption time in-home, based on a total net reach of 4.6 million2 Hong Kongers
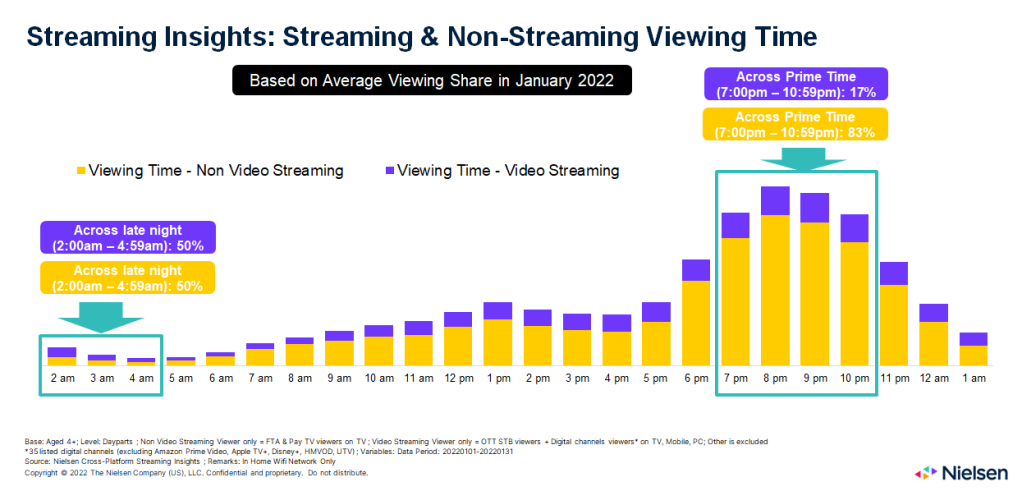
- The average Daily Share of Video Streaming across total video time increases after 9 pm and it reaches 52% at 3 – 4 am
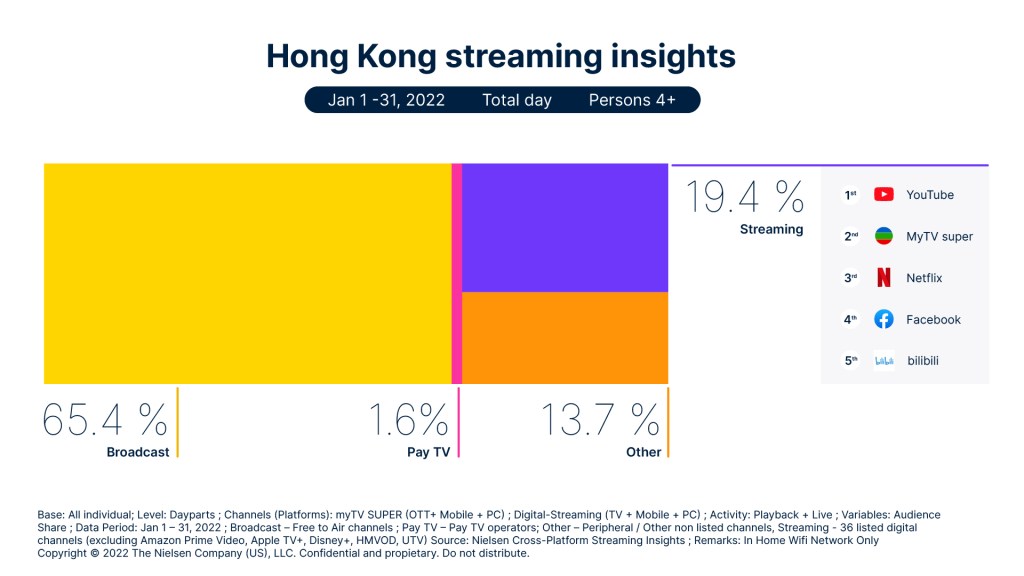
- YouTube and myTVSuper round out the top twoA streaming platforms but top 5 ratings are not the same for every week of the month
Hong Kong, 17 February 2022 – Today, Nielsen (NYSE: NLSN) released streaming platform insights revealing that 4.6 million2 in-home viewing Hong Kongers spent 10.1 billion1 minutes streaming3 for the month of January 2022.
Nielsen’s streaming platform insights also reveal that video streaming platforms accounted for 19.4% of audienceB total video time. It also provides a view into the broadcastC share of audience total video time of 65.4% during the same period.
Clare Lui, Vice President, Nielsen Media, commented: “As we look at the full month of streaming insights data for January 2022, we see that audiences behave differently with streaming versus linear feeds. Nielsen is eager to help both buyers and sellers to understand these shifts to better connect with their audiences.”
Ranjeet Laungani, Managing Director for Nielsen in North Asia said “Nielsen’s Streaming Platform Insights helps buyers and sellers of media to understand the impact of in-home streaming across devices and the interplay between streaming and linear TV viewing. Today, Nielsen’s exciting global vision of Nielsen ONE is one giant step closer to cross-media measurement reality in Hong Kong.”
Sobre a Nielsen Streaming Platform Insights
O Nielsen Streaming Platform Insights usa painéis alimentados por pessoas e tecnologia de medição exclusiva para medir a plataforma em que o streaming é feito e o dispositivo usado para fazer o streaming (smart TVs, dispositivos conectados, consoles de videogame, computador, celular).
Ao combinar quem, onde e o quê, podemos criar uma visão macro de como o público se envolve com várias plataformas de streaming em casa. Essa inteligência pode ajudá-lo a tomar decisões críticas sobre as melhores maneiras de alcançar o público desejado, aprimorar o conteúdo orientado ou otimizar sua estratégia de aquisição de assinantes.
Fontes:
- Base: Aged 4+ ; Level: Dayparts ; myTV SUPER (OTT + Mobile + PC) ; Other Digital Streaming channels (TV + Mobile + PC) ; Activities: Live + Playback; Variables: as stated above ; Data Period: January 1 – 31, 2022
Observações: Somente rede doméstica
- Base: Aged 4+ ; Variables: Net Reach; Data period: January 1 – 31, 2022
- Nielsen Streaming Platform Insights; Data period: January 1 – 31, 2022
Observações:
As percepções da plataforma de streaming da Nielsen refletem a atividade de streaming somente na rede de internet doméstica (por exemplo, conexão de internet com ou sem fio). A atividade de streaming fora de casa ou o streaming dentro de casa que ocorre fora da rede de Internet doméstica (por exemplo, por meio de uma conexão de celular) são excluídos.
A: Ranking is based on 35 listed digital channels (100Most, 17 Live, Big Big Channel, Big Big Fun, Bilibili, Douyin, Facebook, HBO Go, HKATV, Hong Kong Open TV, i-Cable, Instagram, IQIYI, myTV SUPER (Including myTV SUPER OTT box streaming), Netflix, Now News, Now Player, Now Sports, Now-E, Oriental Daily, PPLive, Qianxun, RTHK On the Go, Sohu, Tencent Video, TikTok, TVB News, TVBAnywhere, UpLive, Viu Yellow, ViuTV Blue, VOOV, Weibo, Youku, YouTube), Data period: Jan 1 – 31, 2022
A Nielsen está continuamente buscando expandir o número de plataformas em nossa medição de streaming. Esta versão exclui atualmente: Amazon Prime Video, Apple TV+, Disney+, HMVOD e UTV.
B: Audience is defined as the 4.6 million Hong Kongers with in-home streaming activity
C: Broadcaster – Free to Air channels
Other – Peripheral (i.e. Video Game, Media box) / Other non listed channels (i.e. Satellite channels)
D: For the Viewing Time share in the 2nd chart, Other is excluded
Sobre a Nielsen
A Nielsen molda a mídia e o conteúdo do mundo como líder global em medição de audiência, dados e análises. Por meio de nossa compreensão das pessoas e de seus comportamentos em todos os canais e plataformas, capacitamos nossos clientes com inteligência independente e acionável para que eles possam se conectar e se envolver com seus públicos - agora e no futuro.
An S&P 500 company, Nielsen (NYSE: NLSN) operates around the world in more than 55 countries. Learn more at www.nielsen.com or www.nielsen.com/investors and connect with us on social media.
Contatos
Minami Nan
Sara Guainazzi
