O aparelho de televisão sempre foi um ímã dentro de casa que reúne amigos e familiares para desfrutar de entretenimento e da companhia uns dos outros. Isso continua sendo verdade hoje, mas o aparelho de TV físico se tornou muito mais do que uma janela para a programação tradicional. A exibição de TV ao vivo e programada continua a ser um elemento fixo em nossas dietas de mídia, mas o streaming está a caminho de representar um terço do tempo total de TV dos consumidores nos EUA até o final deste ano.
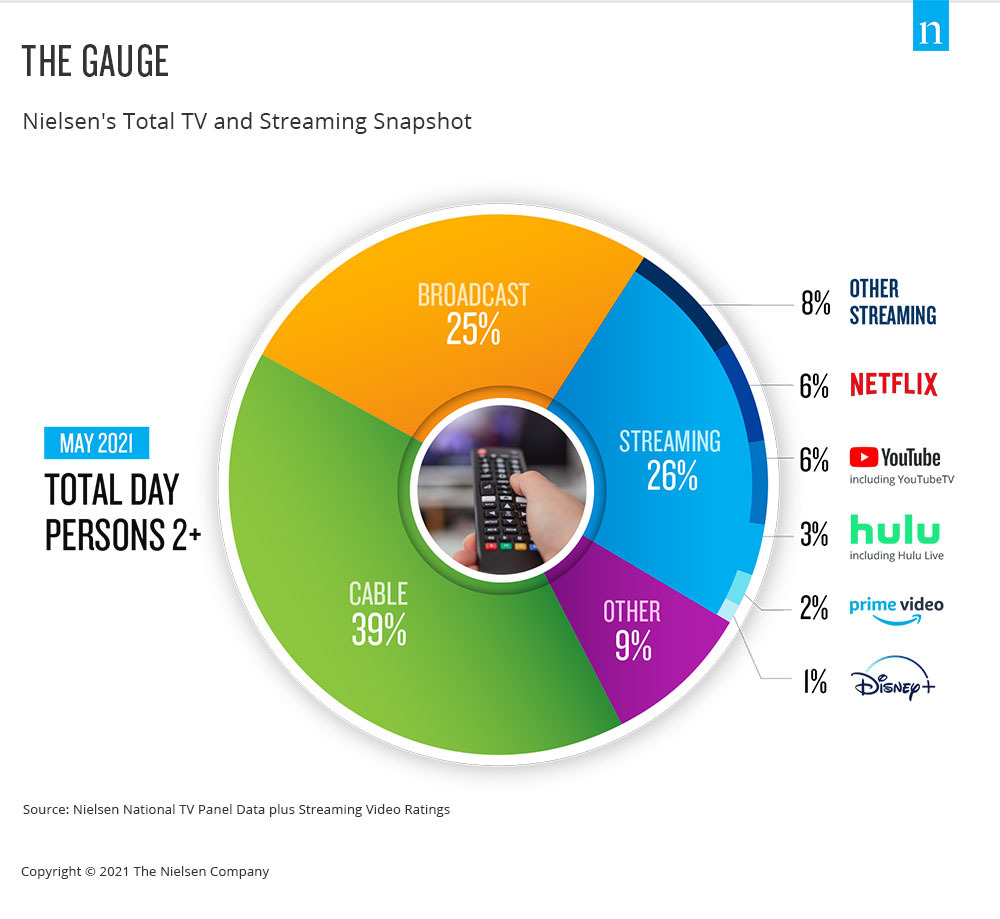
Few areas of the media landscape have been in focus over the past year as streaming video content has, and the TV set is a key portal for that engagement. There is no shortage of news and hype about the streaming landscape, as well as how streaming engagement has dramatically altered video viewing, as it now accounts for 26% of total TV usage. While that statistic is telling on its own, it doesn’t contextualize streaming usage within the broader usage of TV.
From a media industry perspective, nothing is more valuable than accurate, comparable data. And as audiences no longer see a difference between traditional TV, streaming and digital, measurement shouldn’t either. That’s where the Gauge, Nielsen’s total TV and streaming snapshot, comes in. This important step forward in the journey toward true cross-platform measurement and Nielsen ONE simplifies TV usage, illustrating television consumption behavior in a single graphic. With this view, to be updated monthly, industry participants will be able to see critical behavioral shifts and consumer trends with respect to total TV viewing. Additionally, the Gauge tracks “other” use of the TV, such as via game consoles, to give an accurate view of what people are doing in their dens and living rooms.
Importantly, the Gauge does more than simply chart streaming behavior within U.S. homes that have the ability to stream. The snapshot represents streaming across all television homes, which means that the share of streaming more accurately represents consumer behavior in a way that’s easy to describe and understand. The new representation also shows select streaming distributor shares against the total television universe so it provides better comparability within television usage.
Acompanhar o crescimento do consumo de streaming - e visualizá-lo juntamente com outros usos da TV - é fundamental, pois estúdios, redes, anunciantes, agências e grupos do setor buscam clareza sobre os diversos conteúdos de vídeo com os quais os consumidores se envolvem.
A abordagem da Nielsen para a medição de audiência, que utiliza um painel geograficamente representativo de pessoas reais e big data, foi criada para o futuro do consumo de mídia. E com o the Gauge, o futuro do consumo de TV é visível em uma única visualização.
For more information visit The Gauge.
Metodologia
- O streaming por meio de decodificadores a cabo não é creditado aos respectivos distribuidores de streaming, mas sim incluído no grupo "todos os outros".
- Data used is derived from two separately weighted panels and combined to create the infographic. Streaming data comes from a subset of TV households in the national TV panel that are enabled with the streaming meter, while linear sources as well as total usage are based on viewing from the overall TV panel.
- O streaming linear codificado é refletido tanto no grupo linear (transmissão, cabo) quanto no respectivo aplicativo de streaming linear (por exemplo, Hulu Live, YouTube TV, outros aplicativos de streaming MVPD/vMVPD)
