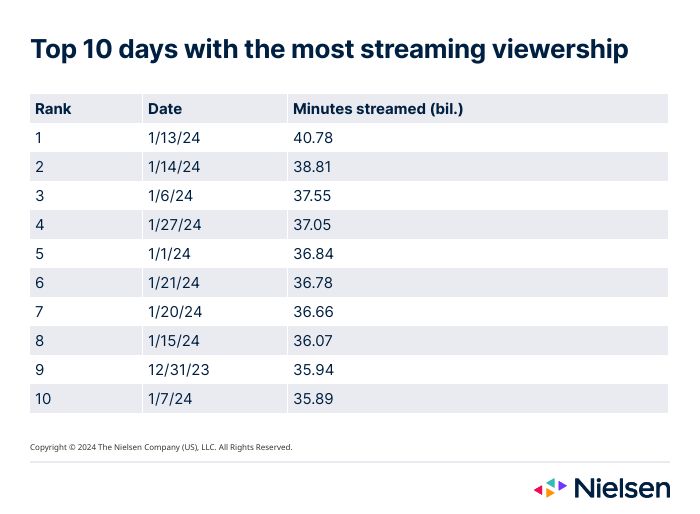
As audiências transmitem um recorde de 40,8 bilhões de minutos de visualização em 13 de janeiro de 2024
Chilly weather, coupled with the excitement of the NFL playoffs, helped boost total TV viewership 3.7% in January. While historically characteristic for the month, the uptick was perhaps more noteworthy because it was 1.4% above its level last year—a reporting period that was longer and wasn’t in short supply of new programming. In fact, January 2024 included three of the top 10 days with the most TV viewing since Nielsen began producing The Gauge in May 2021.
Embora o futebol americano seja sempre um grande impulsionador da audiência de TV, o clima mais frio do que o normal desempenhou um papel importante na audiência de TV em mercados que não são tão frios sazonalmente, incluindo Tulsa e Portland, onde a audiência de TV aumentou 10% e 7%, respectivamente. E em Tampa, as temperaturas mais frias e a corrida dos Buccaneers para os playoffs se combinaram para aumentar a audiência da TV em 14% em uma base anual.
O poder dos playoffs da NFL também repercutiu no cenário de streaming, já que o jogo do Wildcard entre Miami Dolphins e Kansas City Chiefs no Peacock gerou quase 3,9 bilhões de minutos de visualização (incluindo a visualização local em Kansas City e Miami) e ajudou o dia 13 de janeiro de 2024 a conquistar a coroa por ter o maior volume diário de streaming já registrado. No total, janeiro de 2024 incluiu nove dos 10 principais dias com os maiores volumes de streaming já registrados pela Nielsen, com a véspera de Ano Novo de 2023 (que foi registrada no intervalo de dezembro) ficando em 9º lugar.
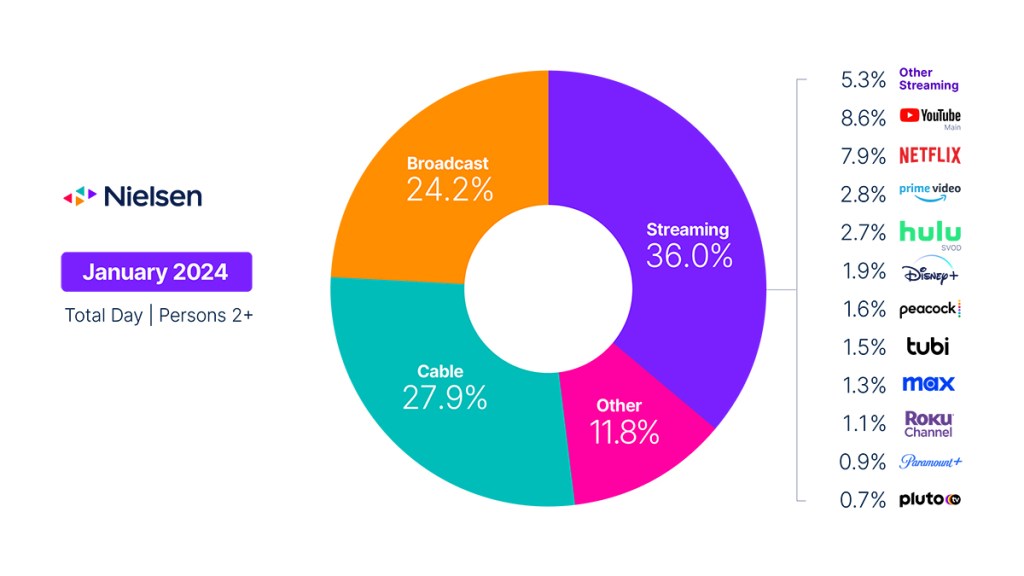
In addition to colder weather, January welcomed the beginnings of new, scheduled drama programming, which accounted for a 20% increase in viewing on broadcast networks. NBC’s Chicago franchise (Chicago Fire, Chicago Med, Chicago P.D.) led the way, representing some of the first “new” scripted content of the broadcast TV season. Combined with a 36% rise in sports viewing, broadcast was able to grow its share of TV by 0.7 share points to end the month at 24.2% of TV. With the arrival of new programming still somewhat limited, however, broadcast viewing was down 20% compared with a year ago.
A audiência de TV a cabo aumentou 2,7% em janeiro, mas o aumento no uso total da TV resultou em uma perda de 0,3 ponto de participação, chegando a 27,9% da TV. A sazonalidade desempenhou um papel importante nesse caso, pois os espectadores se afastaram dos filmes com tema de férias, o que levou a uma queda de mais de 19% na audiência de filmes. Comparativamente, a exibição de notícias aumentou, respondendo por 19% do uso geral da TV a cabo, com o Iowa Town Hall no Fox News Channel tornando-se o único programa não esportivo a ficar entre as 10 principais transmissões a cabo (excluindo comentários esportivos). E, embora a programação esportiva tenha sido menos predominante na TV a cabo, os jogos de futebol americano dominaram os programas mais assistidos, incluindo o jogo do College Football Playoff entre Michigan e Alabama no dia de Ano Novo, que ficou em primeiro lugar com 26,1 milhões de espectadores.
Like broadcast, streaming also benefited from the return of new scripted programming, with Fool Me Once on Netflix topping the list of most-watched programs with 6.5 billion minutes—the first time an original has topped the streaming charts since Queen Charlotte – A Bridgerton Story did so in May 2023. Azulado, on Disney+, and Reacher, on Amazon Prime Video, were close behind, with 5.5 billion minutes and 4.3 billion minutes, respectively. In total, streaming usage was up 4.1% in January.
Em nível de plataforma, o YouTube marcou seu 12º mês consecutivo como o principal serviço de streaming. O Peacock registrou um aumento de 29% no uso, impulsionado pela cobertura dos playoffs da NFL, representando uma participação recorde de 1,6% na TV. A Netflix ganhou 0,2 ponto de participação para encerrar o mês com 7,9% da TV, seu maior índice desde agosto de 2023, e o aumento de 10% no uso do Roku Channel elevou sua participação de volta para 1,1% do total da TV.
O mês de fevereiro, além de incluir a audiência do Super Bowl, marcará o início formal de uma temporada abreviada de TV aberta, o que poderá compensar algumas das quedas de audiência que normalmente ocorrem após o final da temporada da NFL. Como a primavera ainda não está no horizonte, a chegada contínua de novos conteúdos nos canais tradicionais e de streaming provavelmente manterá o público envolvido até a chegada do clima mais quente.
Tendências de dados de janeiro com Brian Fuhrer
The Gauge provides a monthly macroanalysis of audience viewing behaviors across key television delivery platforms, including broadcast, streaming, cable and other sources. It also includes a breakdown of the major, individual streaming distributors. The chart itself represents monthly total television usage, broken out into share of viewing by category and by individual streaming distributors.
Metodologia e perguntas frequentes
Como o "The Gauge" é criado?
The data for The Gauge is derived from two separately weighted panels and combined to create the graphic. Nielsen’s streaming data is derived from a subset of Streaming Meter-enabled TV households within the National TV panel. The linear TV sources (broadcast and cable), as well as total usage are based on viewing from Nielsen’s overall TV panel.
Todos os dados são baseados no período de tempo para cada fonte de visualização. Os dados, que representam um mês de transmissão, baseiam-se na visualização Live+7 para o intervalo do relatório (Observação: Live+7 inclui visualização de televisão ao vivo e visualização até sete dias depois para conteúdo linear).
What is included in “other”?
Within The Gauge, “other” includes all other TV usage that does not fall into the broadcast, cable or streaming categories. This primarily includes all other tuning (unmeasured sources), unmeasured video on demand (VOD), audio streaming, gaming and other device (DVD playback) use.
Beginning with the May 2023 interval, Nielsen began utilizing Classificações de conteúdo de streaming to identify original content distributed by platforms reported in that service to reclassify content viewed via cable set top boxes. This viewing will credit to streaming and to the streaming platform which distributed it. It will also be removed from the other category, where it was previously reflected. Content not identified as original within Streaming Content Ratings and viewed through a cable set top box will still be included in other.
O que está incluído em "outro streaming"?
As plataformas de streaming listadas como "outros tipos de streaming" incluem qualquer streaming de vídeo de alta largura de banda na televisão que não esteja separado individualmente. Os aplicativos projetados para fornecer transmissão ao vivo e programação a cabo (linear) (aplicativos vMVPD ou MVPD, como Sling TV ou Charter/Spectrum) estão excluídos de "outro streaming".
Qual é a contribuição do streaming linear?
Linear streaming (as defined by the aggregation of viewing to vMVPD/MVPD apps) is excluded from the streaming category as the broadcast and cable content viewed through these apps credits to its respective category. This methodological change was implemented with the February 2023 interval.
E quanto à transmissão ao vivo no Hulu e no YouTube?
O streaming linear por meio de aplicativos vMVPD (por exemplo, Hulu Live, YouTube TV) é excluído da categoria de streaming. "Hulu SVOD" e "YouTube Main" na categoria de streaming referem-se ao uso das plataformas sem a inclusão de streaming linear.


