É provável que o mundo nunca tenha sido tão dependente da conectividade como se tornou no último ano. Com a maior parte do mundo passando mais tempo em casa, a tecnologia se tornou a linha de vida para tudo, desde o comércio até as reuniões sociais e o entretenimento mais recente. Muito já foi escrito sobre essas áreas, mas considerando que a conectividade permite que milhões de americanos trabalhem em casa e proporciona a inúmeras crianças de todo o país acesso à educação virtual, é justo dizer que o virtual é o novo IRL.
That has inspired many Americans to think about where they want to live. Especially if a physical office location is no longer a consideration, the idea of relocation becomes a real option, particularly for those seeking to escape the density of heavily populated urban areas. Many consumers sought temporary solace away from big cities early on, but the prolonged duration of the COVID-19 pandemic has metro-dwellers thinking about more permanent moves, especially as many work-from-home and remote schooling arrangements remain intact.
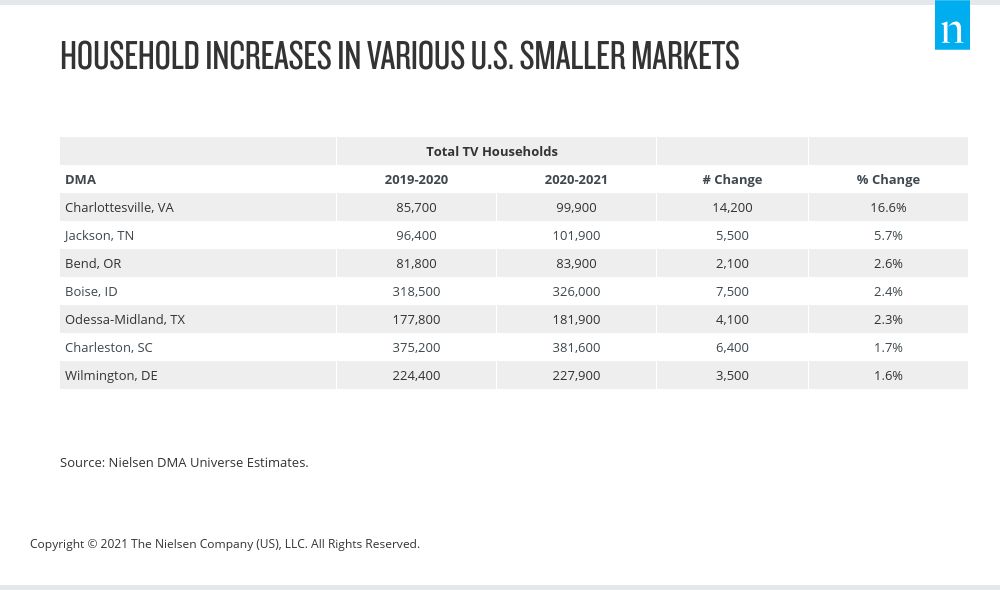
The prospect of moving could have long-lasting implications for the distribution of the U.S. population. According to recent Oliver Wyman research, one in five urban dwellers is planning to move or considering a move because of the pandemic. And we’re already starting to see the shift. In looking at Nielsen’s year-over-year U.S. household data, we can see increases in an array of smaller-sized designated market areas (DMAs). Many of the increases represent changes of less than 2%, but a handful have been more significant, with the Charlottesville, Va., DMA registering a 16.6% increase in households between the 2019-2020 and 2020-2021 universe estimate periods.
Essa tendência é importante para as marcas e os anunciantes que buscam manter contato com os consumidores à medida que seus hábitos - e seus habitats - mudam.
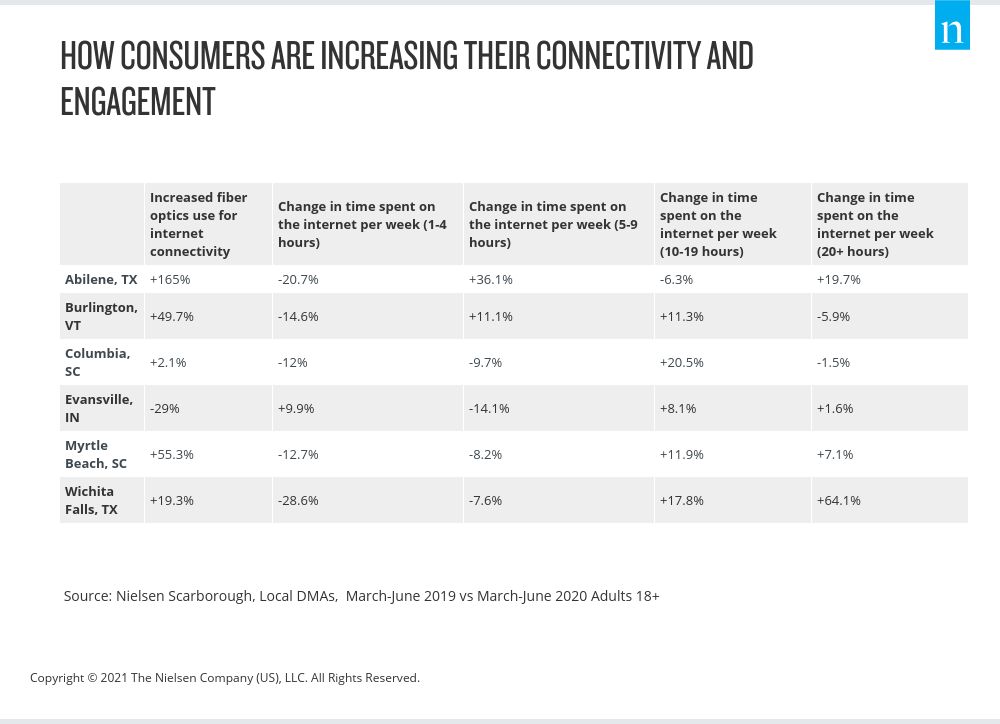
Importantly, many of the country’s lesser-populated DMAs present a valuable opportunity given how digitally engaged their residents are. Whether they’re in cities in Texas, South Carolina, Indiana, Florida or Colorado, consumers in these markets are spending more time connected online. In Abilene, Texas, for example, which is just over 200 miles away from Austin, household use of fiber optics connectivity had increased 165% according to the survey data from Nielsen Scarborough. That connectivity has facilitated a 36% increase in usage of five to nine hours online per week, as well as nearly a 20% increase in usage of 20 hours or more online. In some DMAs, such as Myrtle Beach, S.C., and Wichita Falls, Texas, we’re seeing decreases in internet usage across shorter periods of time and increases in usage across longer periods of time.
Além de passar cada vez mais tempo usando a Internet, os consumidores de muitas áreas menos populosas estão seguindo a tendência nacional de se inclinar para o crescente domínio do streaming e do vídeo sob demanda. No segundo trimestre de 2020, os consumidores dos EUA estavam gastando em média 1 hora e 14 minutos por dia com seus dispositivos conectados à Internet, em comparação com apenas 50 minutos há um ano. Grande parte desse tempo é gasto assistindo a conteúdo de streaming, que, de acordo com a medição da Nielsen TV, representou 23% do tempo total de TV em residências com capacidade de streaming em dezembro de 2020. E, embora as cinco grandes plataformas de streaming de vídeo sob demanda (SVOD) (Netflix, Amazon Prime, Disney+, Hulu e YouTube) tenham sido responsáveis por 53% dos minutos de streaming por semana, os inúmeros provedores da categoria "outros" agora acumulam os outros 47%.
Multichannel video programming distributors (MVPDs; traditional cable companies that augment traditional delivery with a streaming app) and virtual MVPDs are newer to the streaming landscape, but accounted for 36% of the “other” category as of July 2020. They’re also gaining in popularity across many of the country’s lesser-populated DMAs, including Abilene, Burlington and Evansville. In Abilene, for example, Nielsen Scarborough survey data shows that consumers’ past 30-day usage of Sling TV (a subscription-based vMVPD) was almost 235% higher than during the previous survey period. Consumers in the Burlington, Vt.-Plattsburgh, N.Y. DMA report an increase of nearly 102%. Comparatively, consumers in Abilene and Burlington report increased or flat usage of the more traditional SVOD services, but the reported increases were notably lower than those reported for vMVPD usage.
Importantly, despite the growing streaming options available to consumers (including free ad-supported offerings), many are focused on premium offerings. For example, according to Nielsen Scarborough data, consumers in Evansville report more than a 5% decrease in using an internet-connected device or app to watch free TV programs. In Myrtle Beach, consumers report a decrease of 26%. In combination with increased stated usage around paid video options, it’s clear that consumers in these DMAs are gravitating toward what interests them rather than what’s free. This speaks volumes about the value of quality content—even as the market is seeing an array of free, ad-supported options come to market. And when you consider that adults 18 and older were spending an average of almost 11-and-a-half hours with media each day as of June 2020, knowing which platforms and programs they’re engaging with—and the markets where they’re engaging—couldn’t be more important.