Paramount wykazuje największy miesięczny wzrost w kwietniowym wskaźniku dystrybutorów mediów, napędzany przez CBS
Disney i NBCUniversal również zyskują udziały
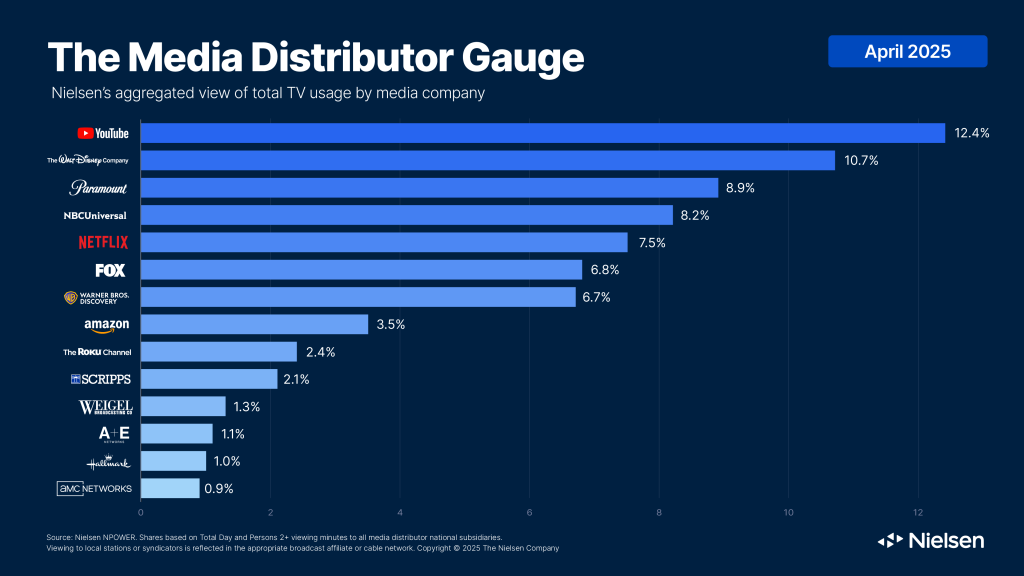
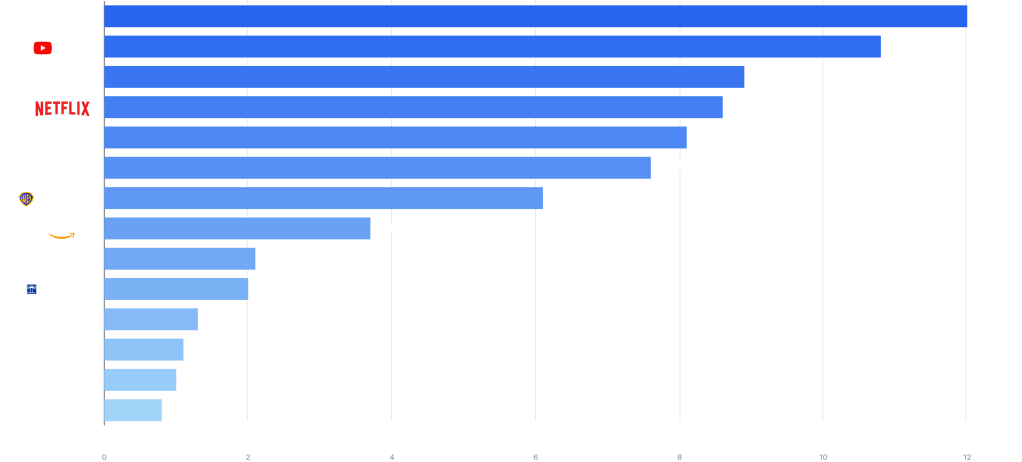
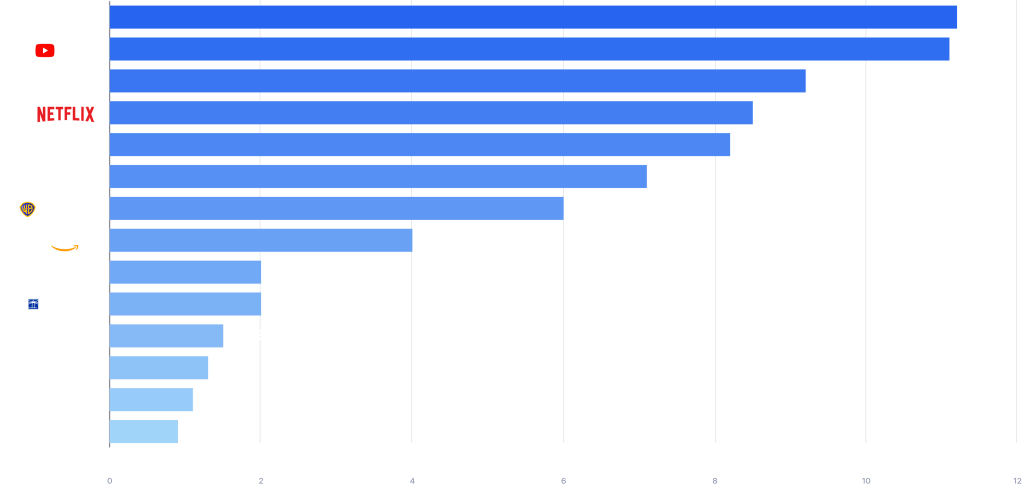
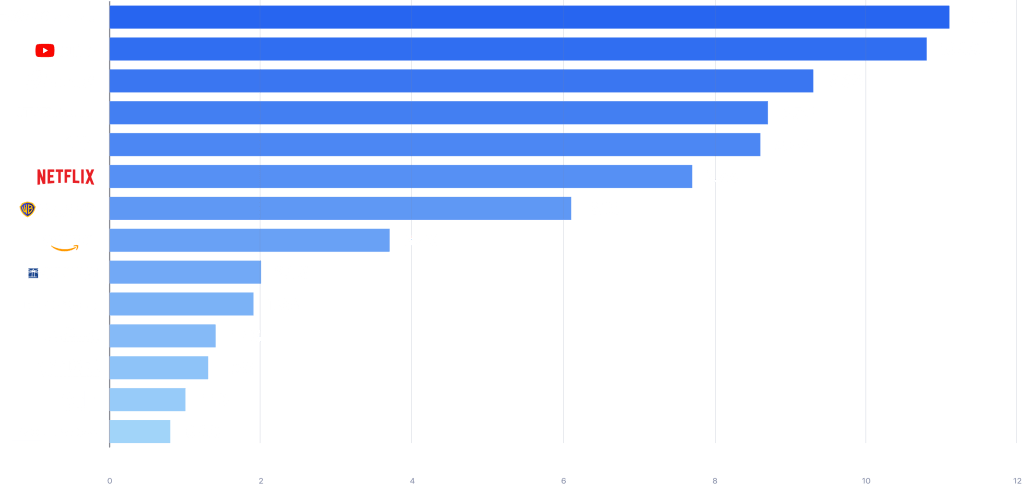
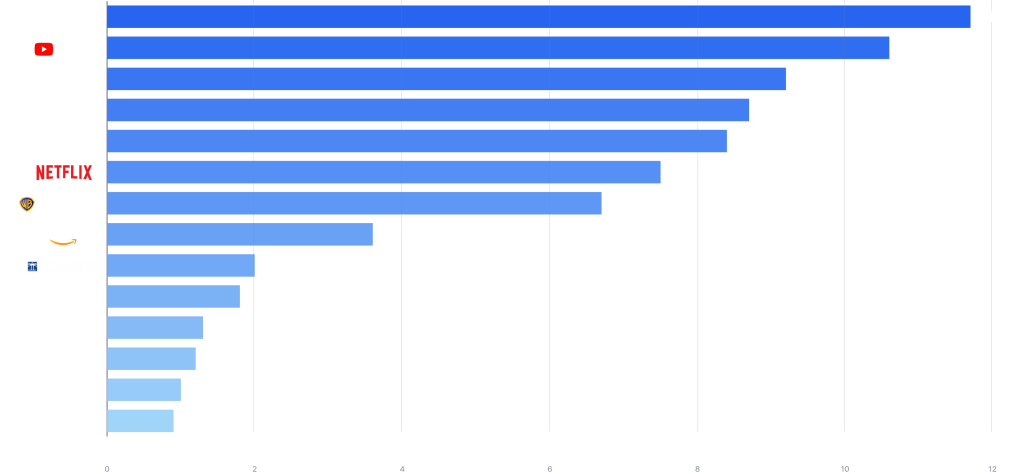
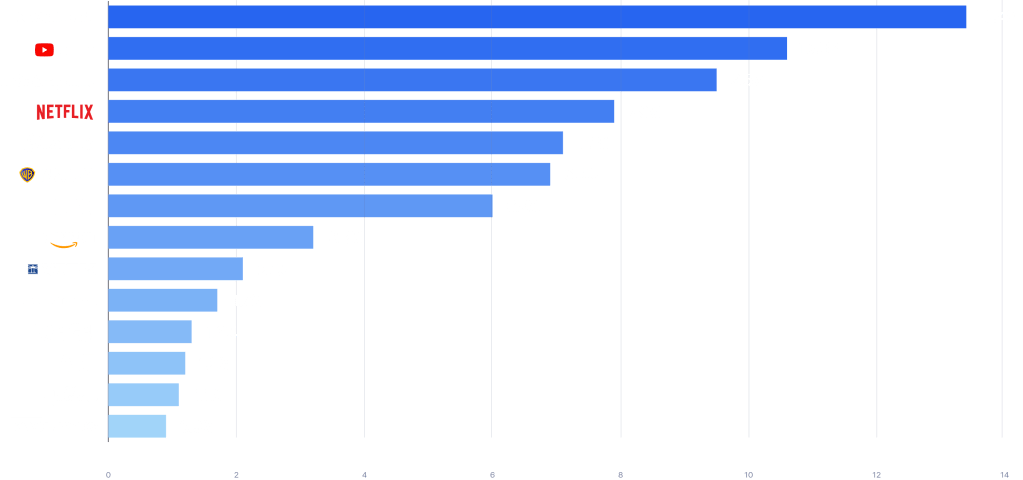
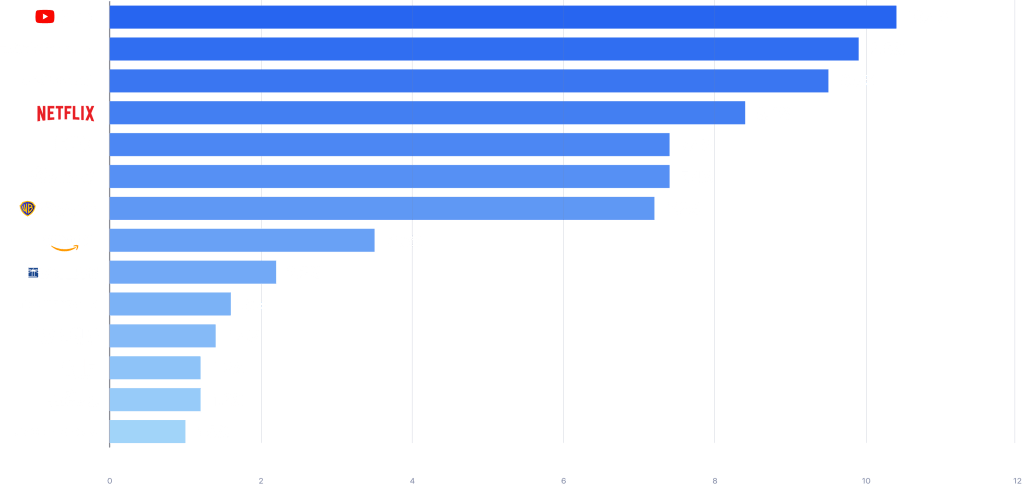
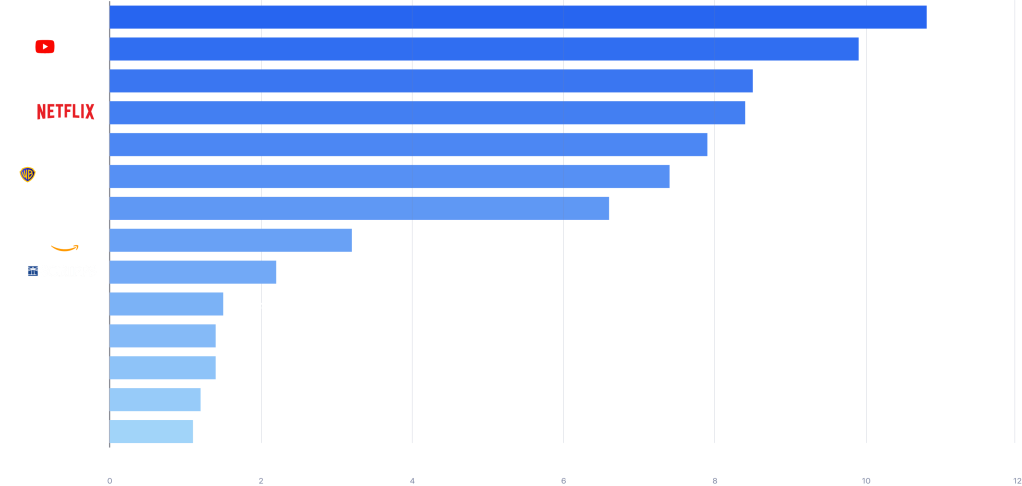
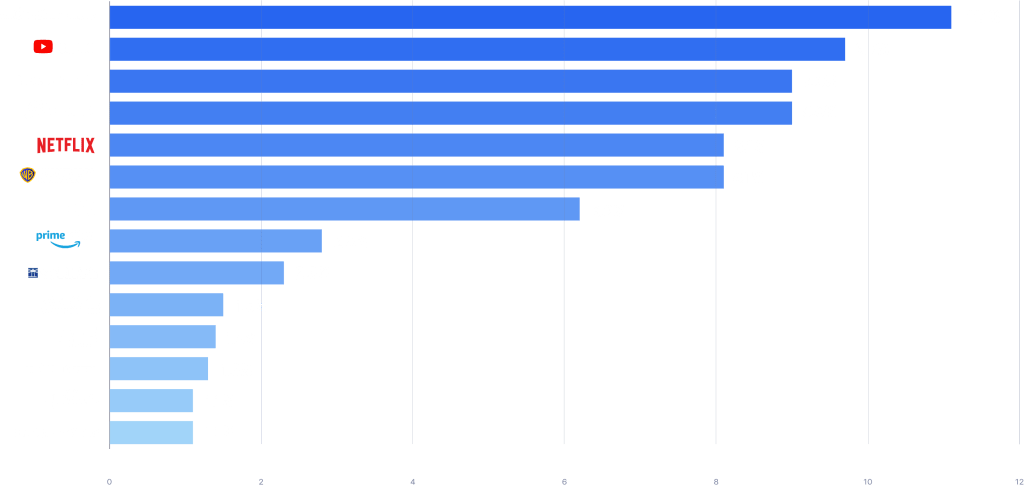
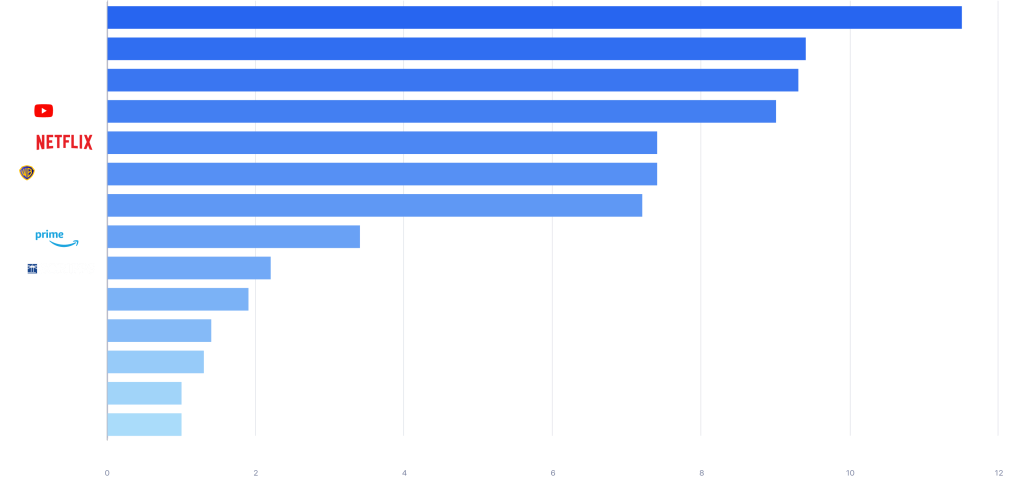
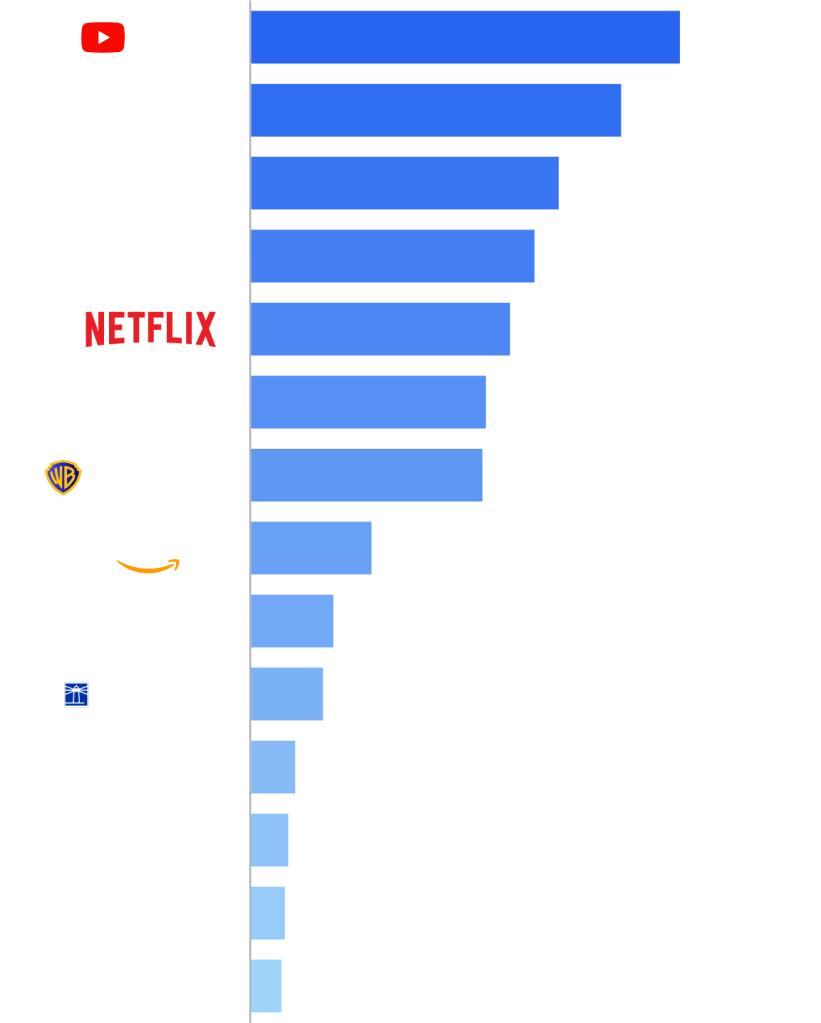
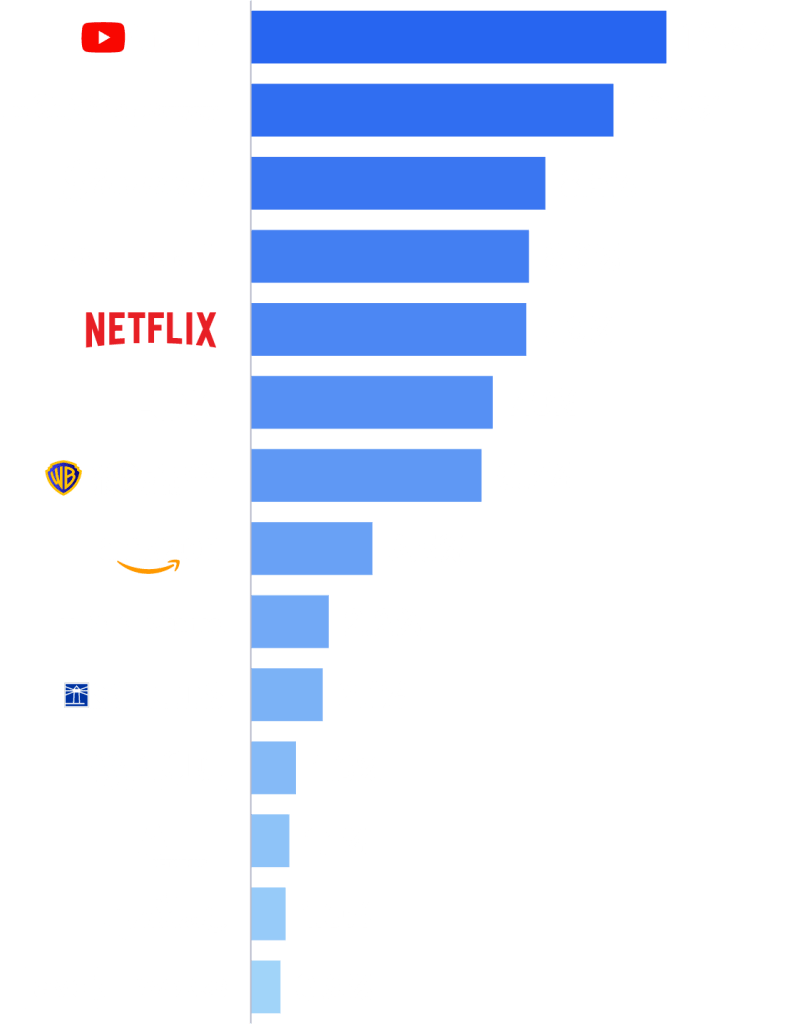
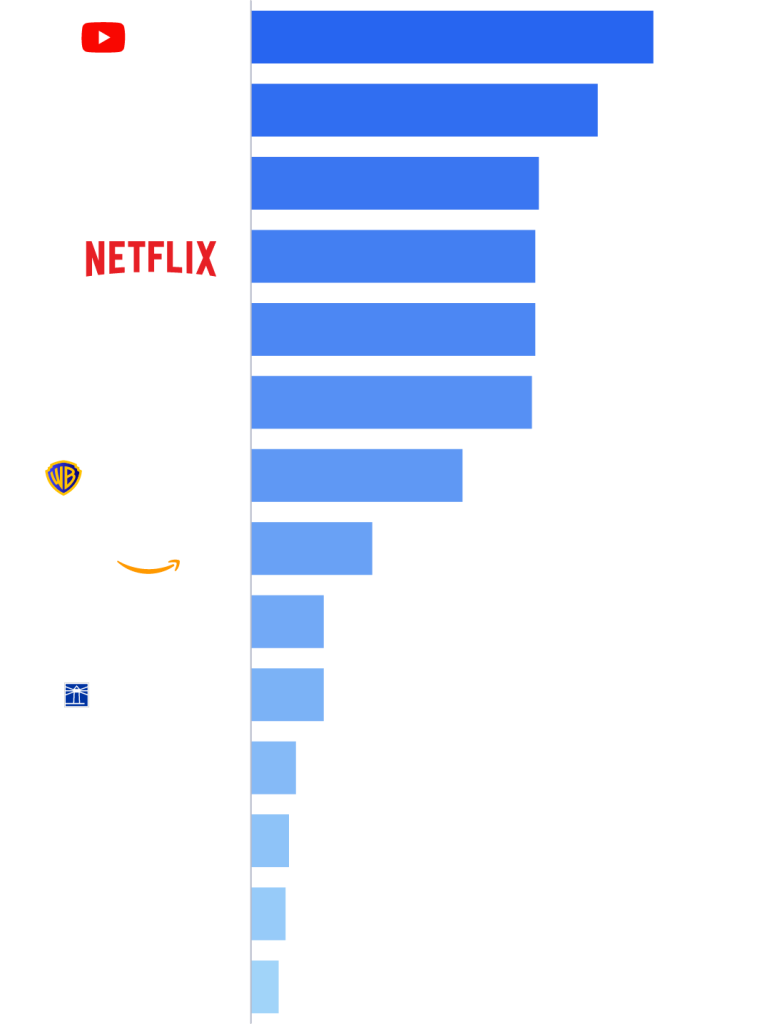
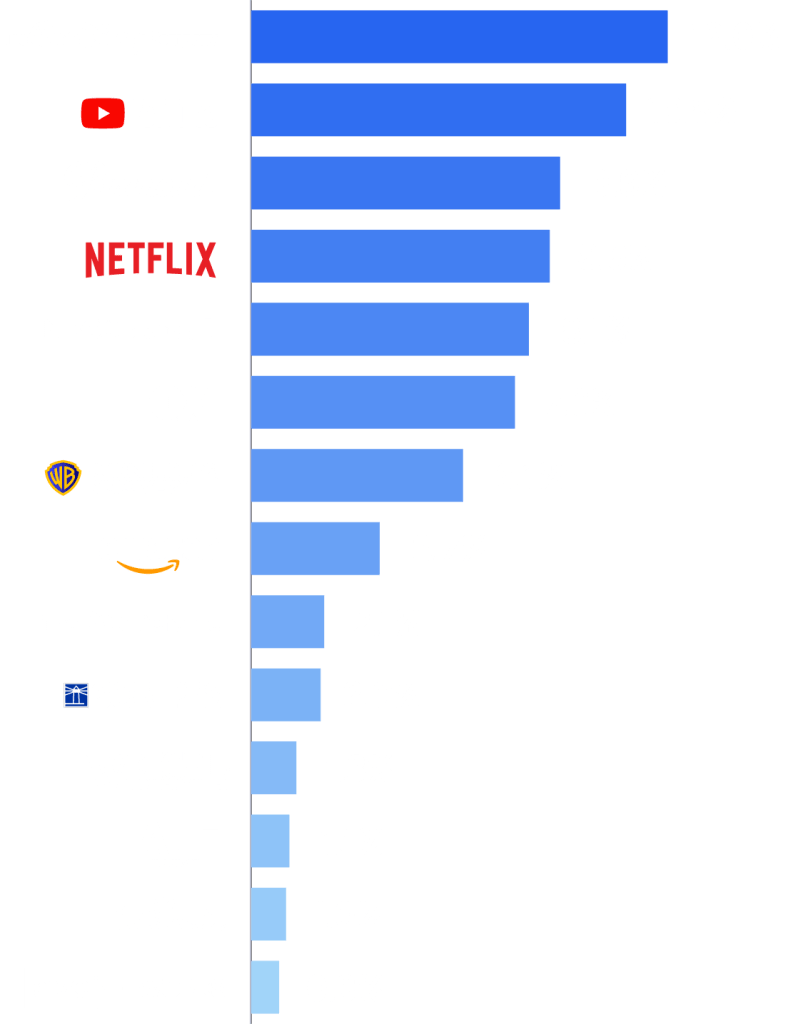
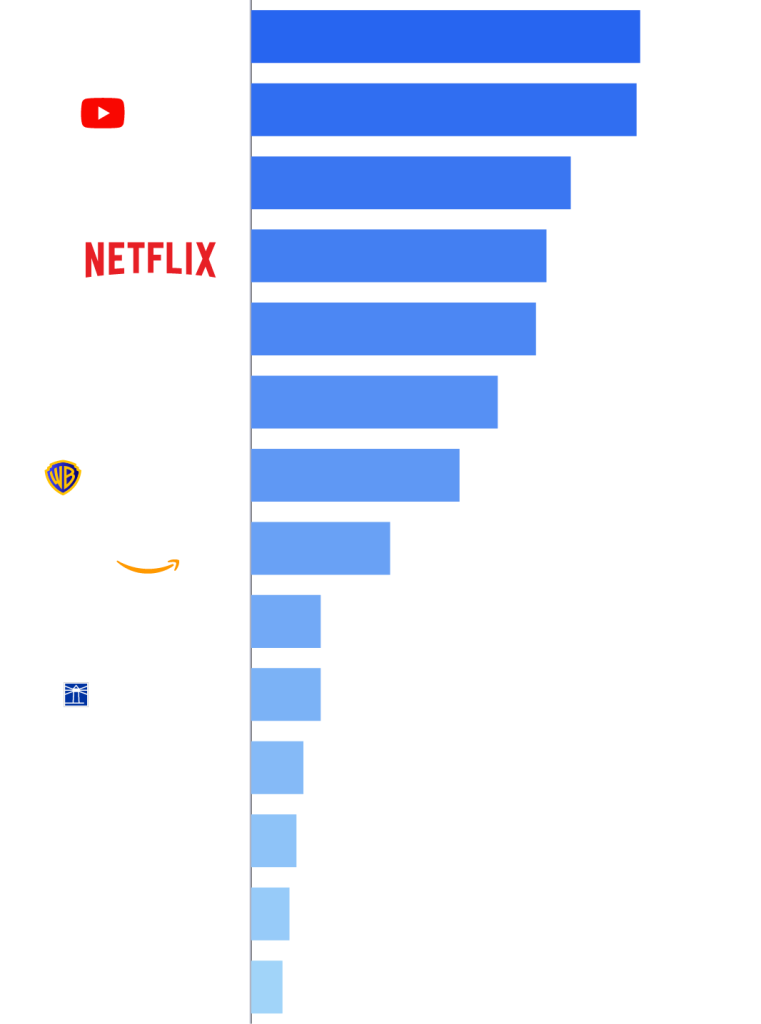
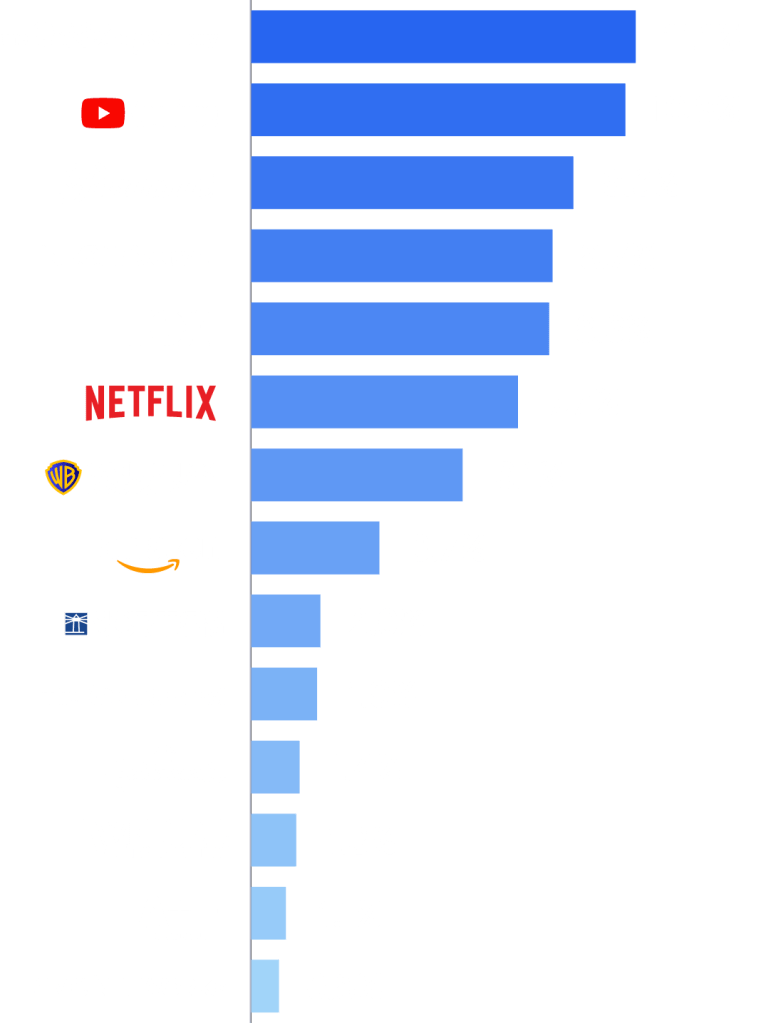
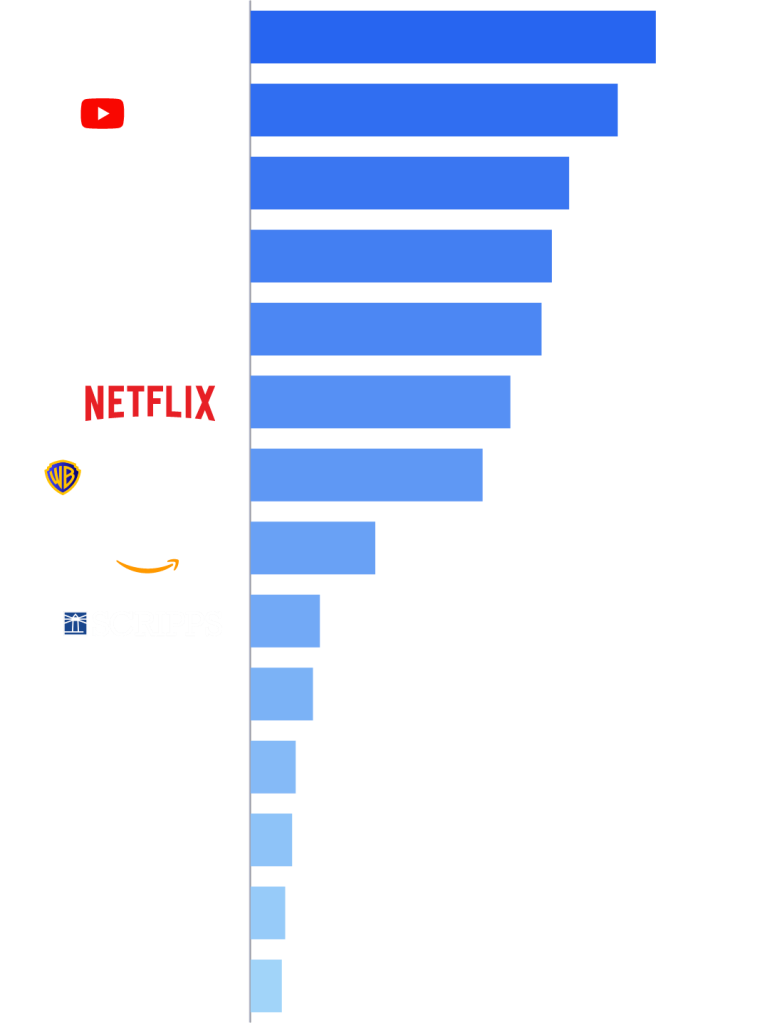
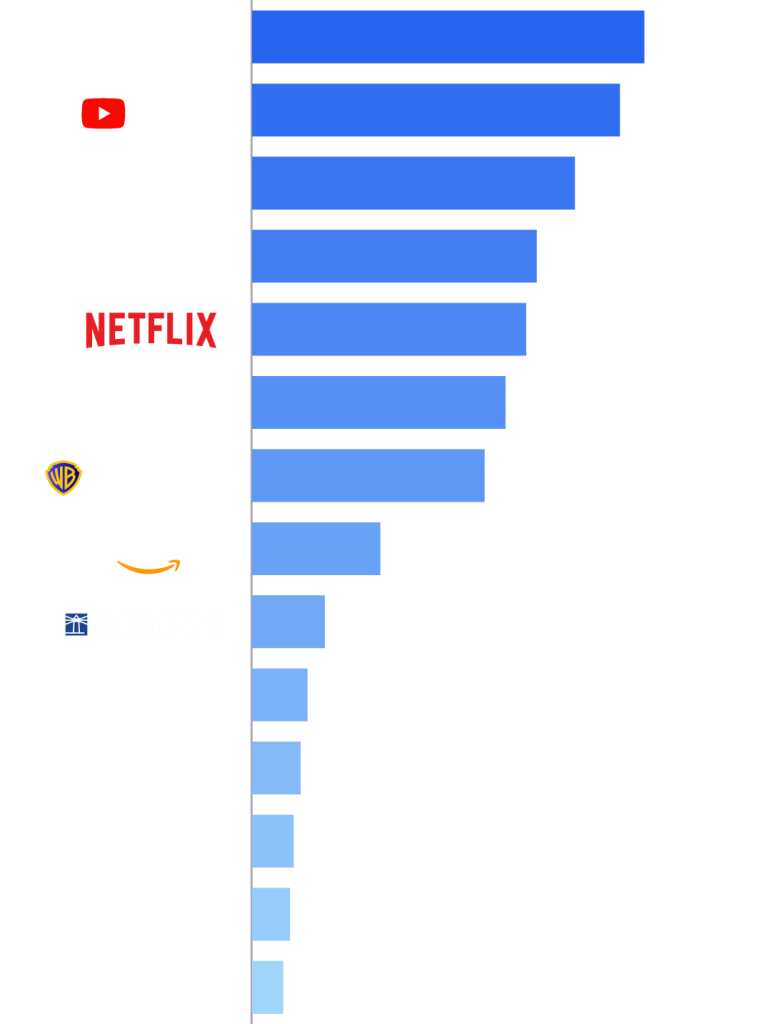
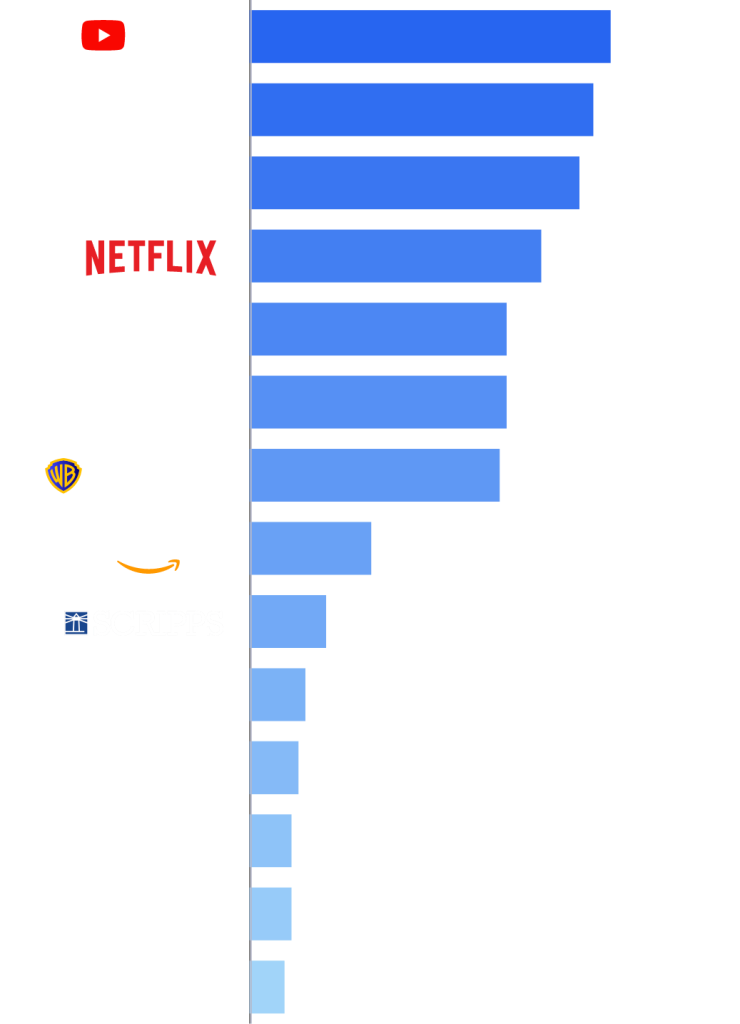
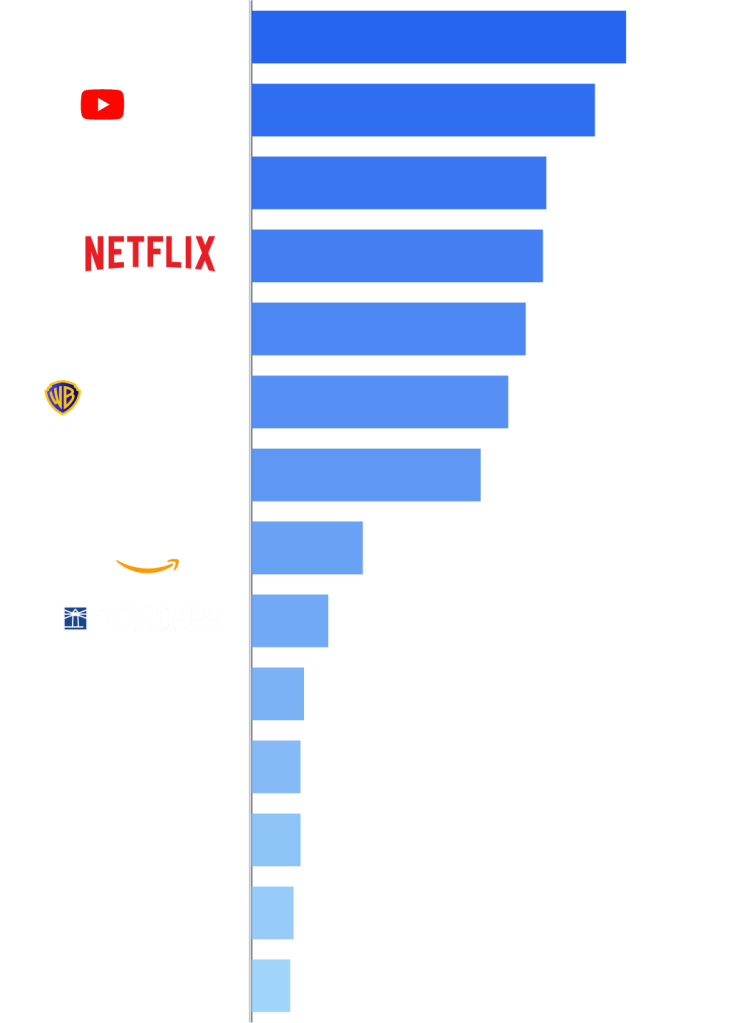
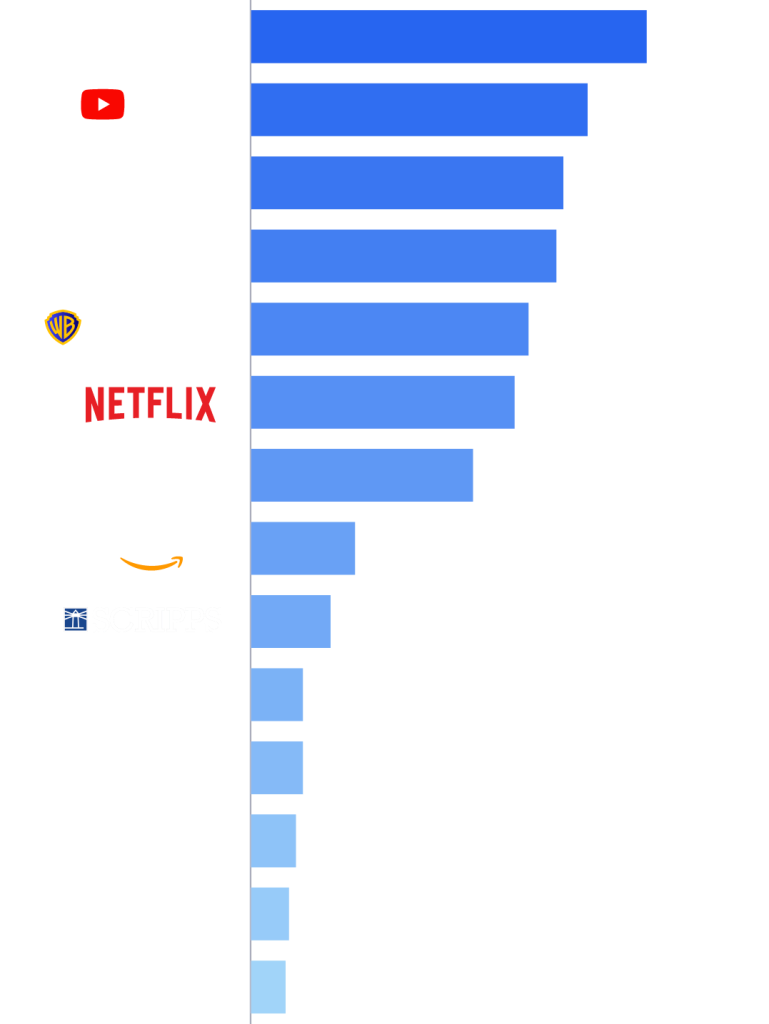
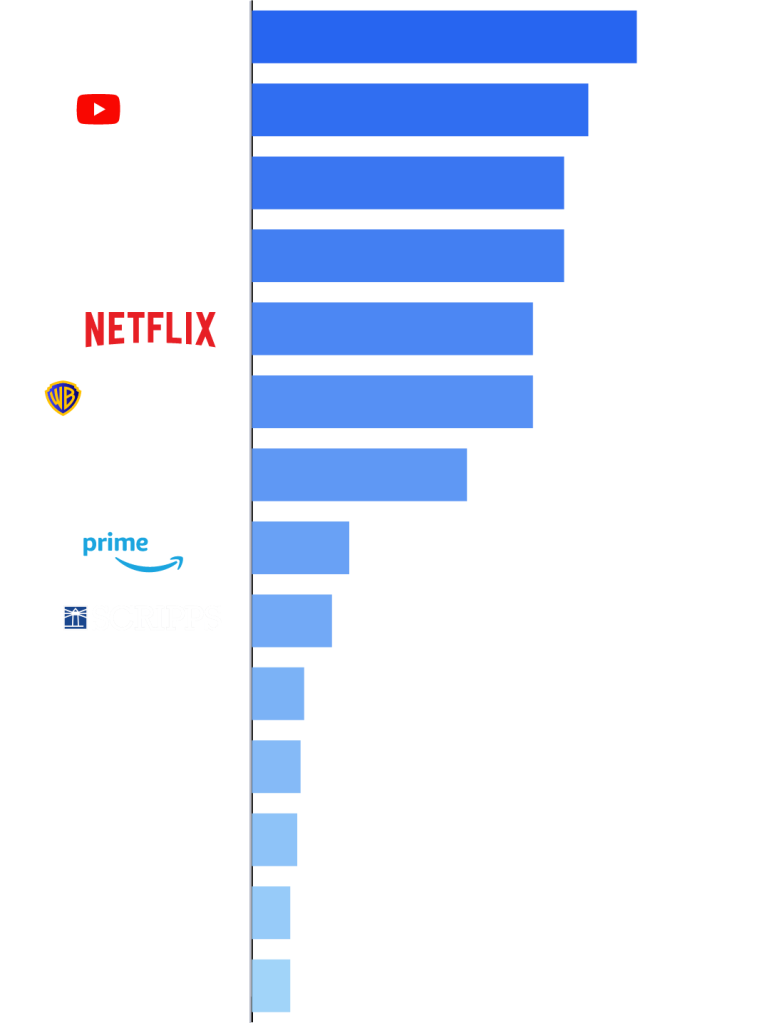
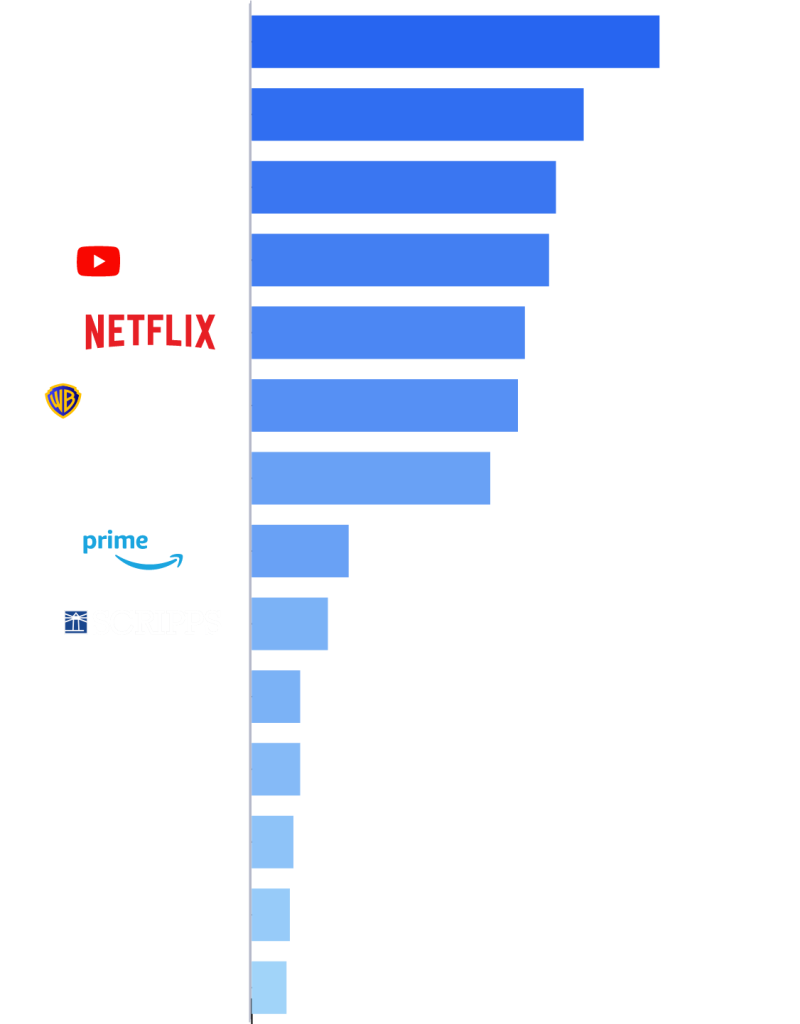
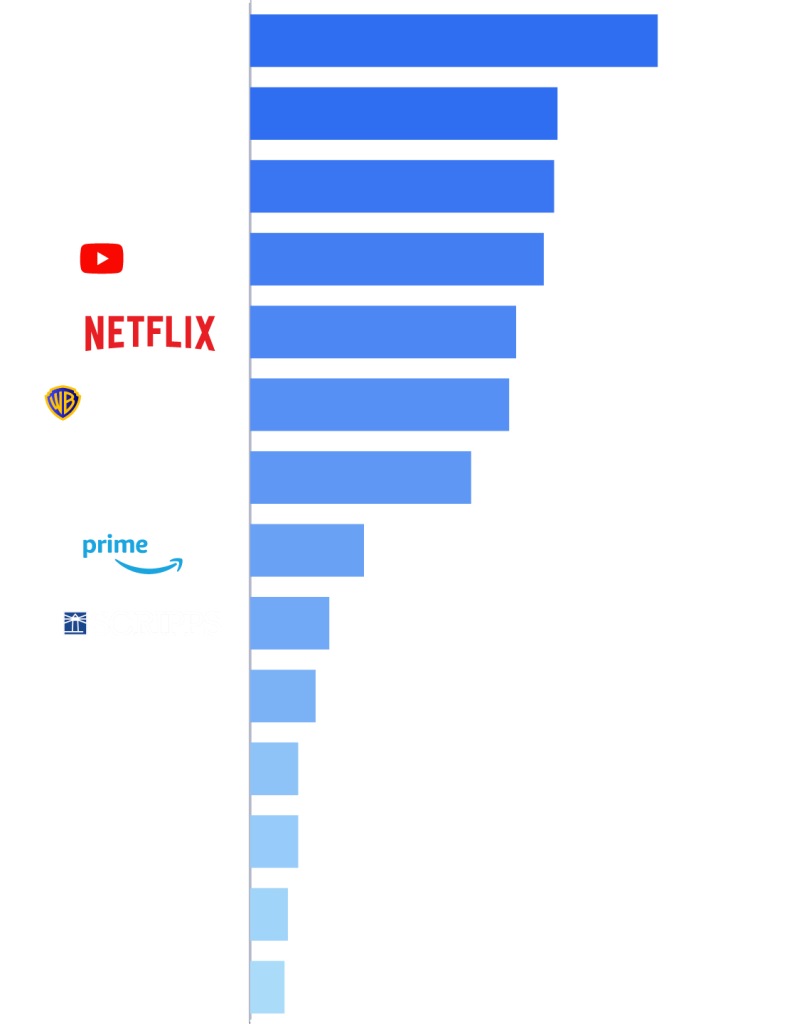
NEW YORK - May 27, 2025 – YouTube maintained its lead among media companies in Nielsen’s April 2025 Media Distributor Gauge report, representing 12.4% of audiences’ time spent watching television. This marks YouTube’s third consecutive month atop the Media Distributor Gauge, as well as its largest share of TV to date.
April 2025 is the first time that company rankings in the Media Distributor Gauge have stayed exactly the same month over month since Nielsen began tracking this data in November 2023. Disney held the second largest share of TV in both April and March, and this month represented 10.7% of total television. Disney’s 0.2 point gain over March was partly driven by cross-network coverage of the NFL Draft, the NCAA Women’s Basketball Championship and the first round of the NBA Playoffs. Disney also owned April’s top streaming title, Chirurdzy, which notched 3.9 billion viewing minutes and benefited from its multichannel and multiplatform availability.
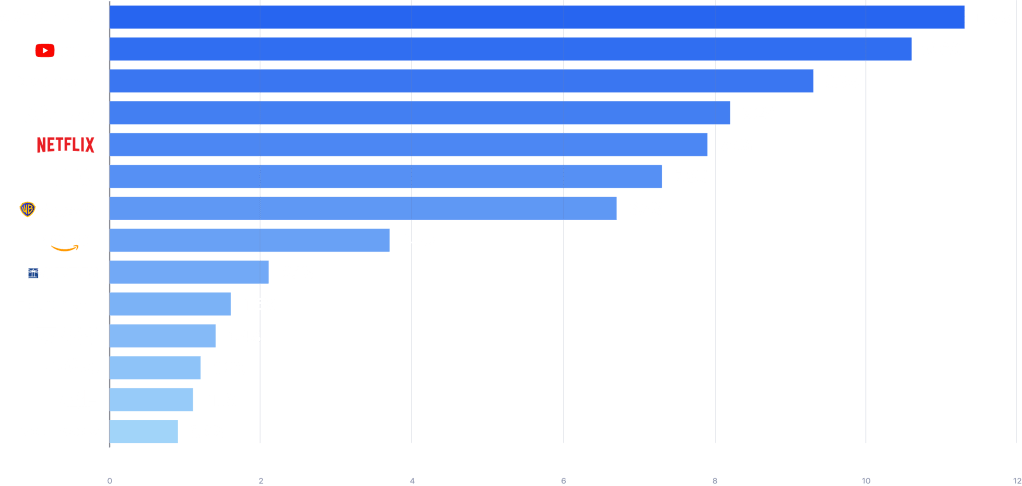
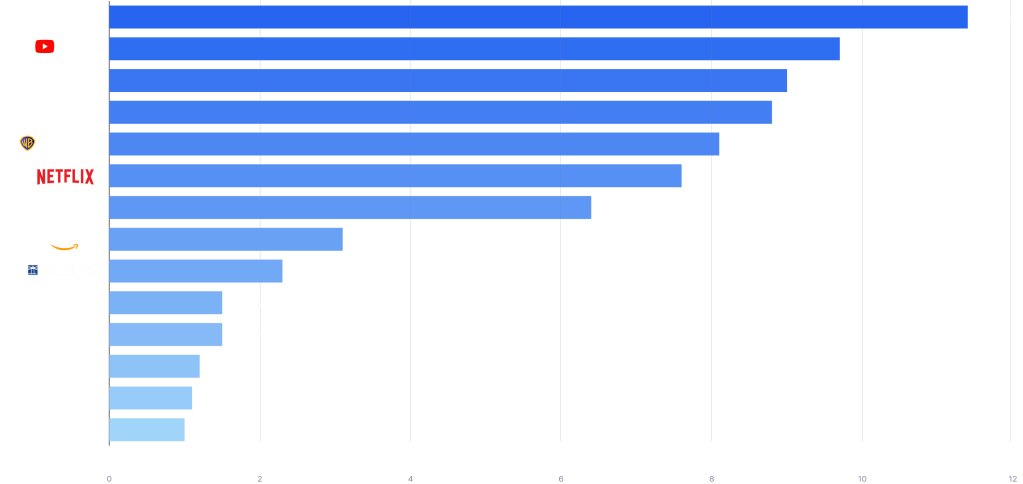
Paramount stanowił 8,9% całkowitego czasu oglądania telewizji w kwietniu i wykazał największy miesięczny wzrost udziału wśród firm medialnych (+0,4 punktu, co w oparciu o niezaokrąglone dane było nieco większe niż wzrost YouTube). Wzrost oglądalności stacji powiązanych z CBS stanowił ponad połowę miesięcznego wzrostu Paramount. NBCUniversal zamknął pierwszą czwórkę dystrybutorów mediów w kwietniu z 8,2% udziałem w telewizji, w porównaniu z 8,0% w marcu.
Warner Bros. Discovery maintained 6.7% of TV usage this month, boosted by a 58% lift in viewership to TNT, which televised 18 first round games of the NBA Playoffs (through April 27). WBD was also buoyed by its HBO series The White Lotus, which was the second most watched streaming title in April with 3.7 billion viewing minutes on Max. The White Lotus was also No. 1 in Nielsen’s Streaming Top 10 during the weeks of 03/31/25 – 04/06/25 and 04/07/25 – 04/13/25, totaling 1.31 billion minutes and 1.25 billion minutes, respectively.
Przedział kwietnia 2025 r. obejmował daty od 31.03.2025 r. do 28.04.2025 r. Raportowanie Nielsena odbywa się zgodnie z kalendarzem transmisji z tygodniami pomiarowymi trwającymi od poniedziałku do niedzieli.


Informacje o The Gauge™
The Gauge™ is Nielsen’s monthly snapshot of total broadcast, cable and streaming consumption that occurs through a television screen, providing the industry with a holistic look at what audiences are watching. The Gauge was expanded in April 2024 to include Wskaźnik dystrybutora mediów, which reflects total viewing by media distributor across these categories. Read more about The Gauge methodology and FAQs.
O firmie Nielsen
Nielsen is a global leader in audience measurement, data and analytics. Through our understanding of people and their behaviors across all channels and platforms, we empower our clients with independent and actionable intelligence so they can connect and engage with their global audiences—now and into the future. Learn more at www.nielsen.com and connect with us on social media (X, LinkedIn, YouTube, Facebook oraz Instagram).
Press Contact
Lauren Pabst
