Auckland, March 11, 2025 – Nielsen Ad Intel, New Zealand’s most comprehensive ad spend monitoring service, today released its 2024 Advertising Spend Report, revealing the top advertisers, highest-investing industries, and key market shifts over the past year.
Handel detaliczny, żywność i telekomunikacja pozostały dominujące, podczas gdy branża farmaceutyczna i ubezpieczeniowa odnotowały znaczące wzrosty, ponieważ marki dostosowały się do zmieniających się zachowań konsumentów i trendów branżowych.
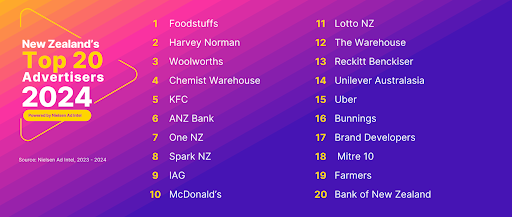
20 największych reklamodawców w Nowej Zelandii w 2024 roku
1. Artykuły spożywcze, 2. Harvey Norman, 3. Woolworths, 4. Chemist Warehouse, 5. KFC, 6. ANZ Bank, 7. One NZ, 8. Spark NZ, 9. IAG, 10. McDonald's, 11. Lotto NZ, 12. The Warehouse, 13. Reckitt Benckiser, 14. Unilever Australasia, 15. Uber, 16. Bunnings, 17. Brand Developers, 18. Mitre 10, 19. Farmers, 20. Bank of New Zealand
Monique Perry, Nielsen Pacific MD said: “The Ad Intel spend data for 2024 tells a clear story – businesses aren’t just maintaining their advertising spend, they’re increasing it! Advertising remains the most effective way to forge strong connections between brands and consumers. Nielsen’s insights have become indispensable for advertisers and agencies looking to stay ahead of the curve”.
Nielsen Ad Intel’s Pacific Commercial Lead, Rose Lopreiato, added: “Retail remains the leader in ad spend, but we’re seeing pharmaceuticals and insurance brands making major strides. With an increasingly dynamic market, these insights are crucial for advertisers refining their strategies and allocating budgets effectively. Nielsen Ad Intel continues to set the industry standard for tracking advertising trends, delivering the clearest and most actionable insights into New Zealand’s evolving media landscape.”
Kategorie reklamowe z największymi inwestycjami w 2024 r.
Pomimo presji ekonomicznej, reklamodawcy w Nowej Zelandii przeznaczyli znaczne budżety w różnych branżach. Liderami były:
1. Fast food, restaurants & cafes – $293 million, 2. Supermarkets – $194 million, 3. Banks – $180 million, 4. Department stores – $153 million, and 5. Homes & properties – $138 million.

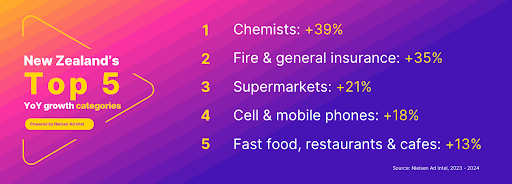
Top 5 kategorii z najwyższym wzrostem rok do roku
Inwestycje w reklamę odnotowały znaczny wzrost w wielu branżach w latach 2023-2024, przy czym prym wiodły branże farmaceutyczna i ubezpieczeniowa:
1. Chemists (+39%), 2. Fire & general insurance (+35%), 3. Supermarkets (+21%), 4. Cell & mobile phones (+18%), and 5. Fast food, restaurants & cafes (+13%).
O firmie Nielsen
Nielsen is a global leader in audience measurement, data and analytics. Through our understanding of people and their behaviours across all channels and platforms, we empower our clients with independent and actionable intelligence so they can connect and engage with their global audiences – now and into the future. Learn more at www.nielsen.com and connect with us on social media (X, LinkedIn, YouTube, Facebook and Instagram).
Informacje o Nielsen Ad Intel
Ad Intel provides the most complete source of cross-platform advertising intelligence available today. With intuitive software, review-and-compare ad activity across media, company, category or brand, plus historical data.
Uwaga: Nielsen monitoruje wydatki reklamowe brutto w głównych mediach według opublikowanych wartości stawek. Niektórzy właściciele mediów udzielają rabatów, ale stawki nie są jawnie dostępne. Należy również pamiętać, że dane dotyczące kategorii i grup marek/produktów są grupowane według uznania firmy Nielsen.
Press Contact
Dan Chapman
dan.chapman@nielsen.com
+61 4040884
