Opierając się na zdefiniowanym przez branżę The Gauge ™, nowy wgląd pokazuje całkowity międzyplatformowy obraz zaangażowania odbiorców według firmy medialnej.
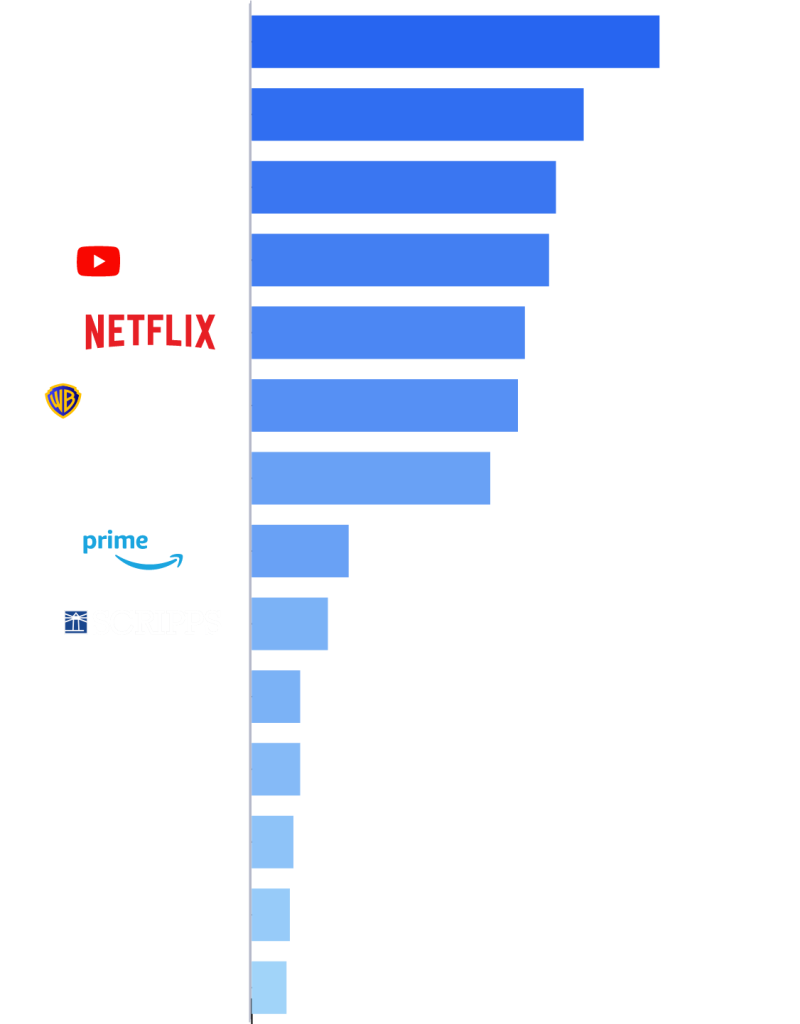
Disney znalazł się na szczycie kwietniowego rankingu dystrybutorów mediów, zajmując 11,5% czasu spędzanego na oglądaniu telewizji.
NEW YORK - May 14, 2024 – Nielsen, a global leader in audience measurement, data and analytics, today launched Wskaźnik dystrybutora mediów, a first of its kind, cross-platform view of total TV consumption across broadcast, cable and streaming, aggregated and ranked by media company. The new insight removes the siloes of traditional television versus streaming, and puts all content distributors on a level playing field to allow for additional perspective of TV viewing today. This new view is being released in addition to The Gauge™ report for April 2024, which is detailed below.
"Ponieważ coraz więcej programów jest dostępnych na różnych platformach, dla twórców, reklamodawców i całej branży ważne jest, aby zrozumieć, co i gdzie oglądają widzowie" - powiedział Karthik Rao, dyrektor generalny Nielsen. "Media Distributor Gauge jest doskonałym uzupełnieniem The Gauge i służy jako pierwsze konwergentne porównanie telewizyjne tego rodzaju. Łącznie raporty te przedstawiają najbardziej kompletny obraz oglądania telewizji, co ma kluczowe znaczenie, gdy zbliżamy się do Upfront".
Ten nowy wgląd jest tworzony poprzez mapowanie wszystkich różnych krajowych dystrybutorów mediów - w tym sieci nadawczych i kablowych oraz usług streamingowych - aż do ich firmy macierzystej. Nielsen oblicza łączną liczbę minut obejrzanych na ekranie telewizora dla usług każdej sieci i agreguje te sumy w oparciu o wstępne mapowanie dystrybutorów, ostatecznie uzyskując udział w całkowitym wykorzystaniu telewizji dla każdej firmy macierzystej. Minimalny próg raportowania dla firmy macierzystej w The Media Distributor Gauge wynosi 1,0% udziału w telewizji. Podobnie jak w przypadku fluktuacji miesięcznego wykorzystania telewizji śledzonego w The Gauge, rankingi w widoku firmy medialnej będą również wykazywać zmiany, które korelują z sezonowością oglądania telewizji.
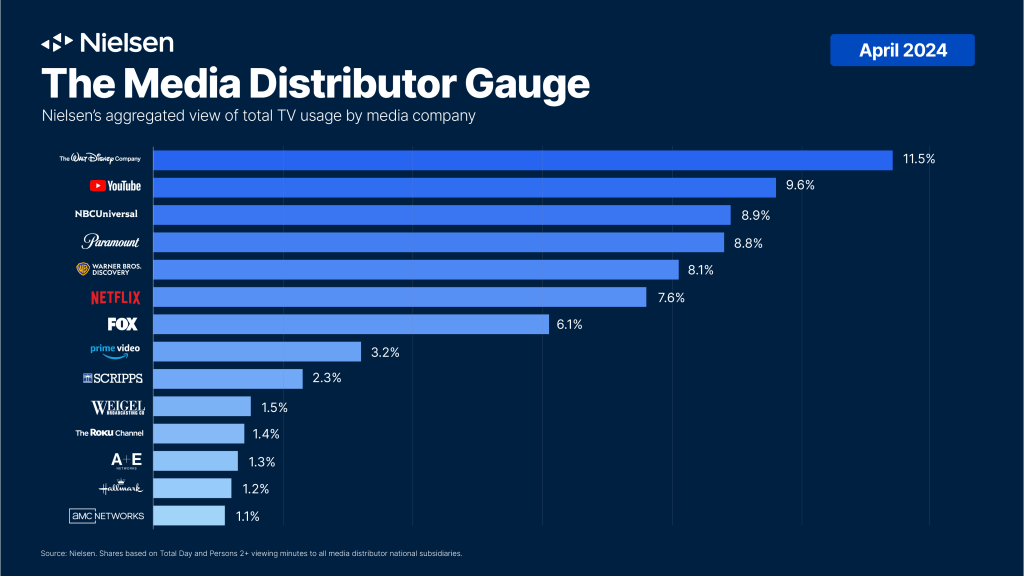
W pierwszym raporcie Nielsena The Media Distributor Gauge, 14 firm medialnych osiągnęło 1,0% lub więcej udziału w całkowitym wykorzystaniu telewizji. W kwietniu Disney uzyskał 11,5% udziału w oglądaniu telewizji, z czego 42% przypadło na Disney+ i Hulu. YouTube był firmą nr 2 z 9,6% udziałem w oglądaniu telewizji w kwietniu, a następnie NBCUniversal z 8,9%, Paramount z 8,8% i Warner Bros. Discovery z 8,1%, aby zamknąć pierwszą piątkę. Netflix uplasował się na szóstym miejscu z 7,6% udziałem w telewizji i był drugim co do wielkości dystrybutorem streamingu.


The Gauge™: Miesięczna migawka Nielsena dotycząca całkowitego wykorzystania telewizji w kwietniu 2024 r.
W kwietniu odnotowano rekordową oglądalność: relacja z turnieju koszykówki kobiet NCAA w telewizji i kablówce oraz nowy oryginalny serial Fallout Amazon Prime Video, który ustanowił nowy rekord dla streamera jako jego najbardziej udany program do tej pory. Z ogólnego punktu widzenia czas spędzony na oglądaniu telewizji był dość stabilny zarówno w ujęciu miesięcznym (spadek o 2%), jak i rocznym (spadek o 0,6%).

W głównych kategoriach oglądalności:
- Kabel was the only category in The Gauge to escape decline as it achieved a second consecutive monthly increase in share, moving up from 28.3% of TV in March to 29.1% (+0.8 pt.) in April. Cable sports viewing increased 28% vs. March, bolstered by NCAA basketball tournament coverage, NBA playoffs and the NFL draft. Women’s NCAA basketball finals and semifinals coverage accounted for four of the top six cable telecasts in April, and the WNBA draft notched 17th. While cable viewing increased about 1% on a monthly basis, a year-over-year comparison shows viewing has declined 8.2% vs. April 2023, and its share has lost 2.4 points.
- Transmisja viewing was down 3% in April, which equated to a 22.2% share of TV (-0.3 pt.). Similar to cable, women’s sports were the bright spot in the broadcast category this month. The NCAA women’s basketball championship game drew 17.6 million viewers on ABC (plus over 1 million more tuned in on ESPN), making it the top broadcast telecast in April by a large margin. The drama genre accounted for 29% of broadcast viewing, driven by Tracker, NCIS and Young Sheldon on CBS, and Chicago Fire and Chicago Med on NBC.
- Streaming viewership declined 1.9% from March to April, prompting the category to lose just 0.1 share point to account for 38.4% of total television. Amazon Prime Video saw the largest increase among streaming services this month with a 12% monthly increase for 3.2% of TV (+0.4 pt.). Prime Video’s April success was driven by its original series Fallout, which also topped all streaming titles this month with over 7 billion viewing minutes. YouTube, despite a 3% monthly decline in viewing, added a 15th month to its streak as the top streaming platform in The Gauge with a 9.6% share of TV in April.
Informacje o The Gauge™
The Gauge™ is Nielsen’s monthly snapshot of total broadcast, cable and streaming consumption that occurs through a television screen. It was expanded in the April 2024 report to include The Media Distributor Gauge, which reflects total viewing by media distributor across these categories. Underpinned by Nielsen’s National TV measurement and Streaming Platform Ratings services, in addition to complimentary insights from its Streaming Content Ratings service, The Gauge provides the industry with a holistic look at the various content audiences are watching. The latest edition of The Gauge is always available at nielsen.com/thegauge.
O firmie Nielsen
Nielsen shapes the world’s media and content as a global leader in audience measurement, data and analytics. Through our understanding of people and their behaviors across all channels and platforms, we empower our clients with independent and actionable intelligence so they can connect and engage with their audiences—now and into the future. Nielsen operates around the world in more than 55 countries. Learn more at www.nielsen.com and connect with us on social media (Twitter/X, LinkedIn, Facebook oraz Instagram).
Press Contact
Lauren Pabst
lauren.pabst@nielsen.com
